Join Curify to Globalize Your Videos
By using Curify, you agree to our
Terms of Service and Privacy Policy
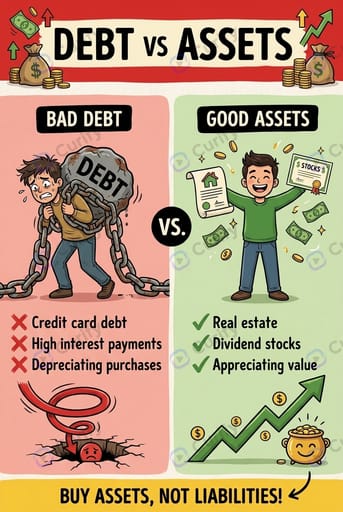
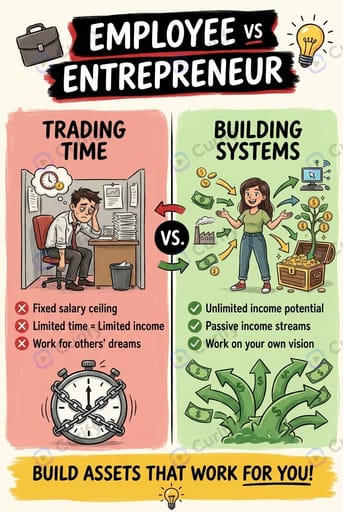
Finance and Money Comparison Infographic
Educational money infographic comparing key financial concepts — saving vs investing, debt vs assets, employee vs entrepreneur, active vs passive income. Friendly cartoon style for personal finance content.
Reproduce this template
Use your inputs — the prompt preview updates instantly.
(Finance & Money Infographic Creator) Create a vibrant, educational infographic poster titled '{topic}'. Layout: Split-screen comparison (two contrasting financial mindsets or actions) with cartoon characters and speech bubbles, key pros/cons bullet points below each side, plus simple icons like money trees, piggy banks, or charts, and a bold motivational banner at the bottom. Style: Bright, friendly cartoon art style, high-contrast red/green color coding, bold typography with thick outlines, clear section dividers, and approachable, relatable characters. Direct high-quality image generation. Subject: '{topic} finance comparison infographic'.Other nano banana templates
Explore other categories and presets.
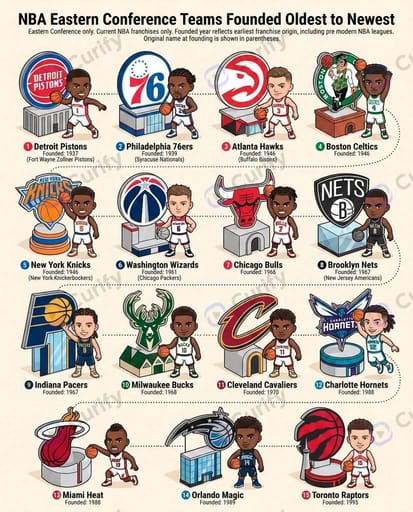
Sports League Team Order Infographic
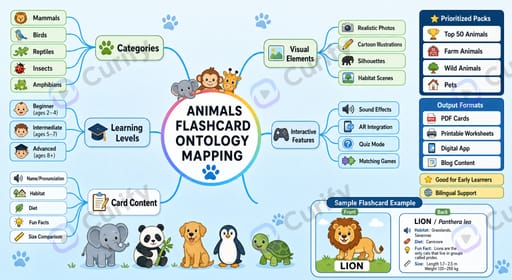
Educational Flashcard Ontology Mindmap Infographic
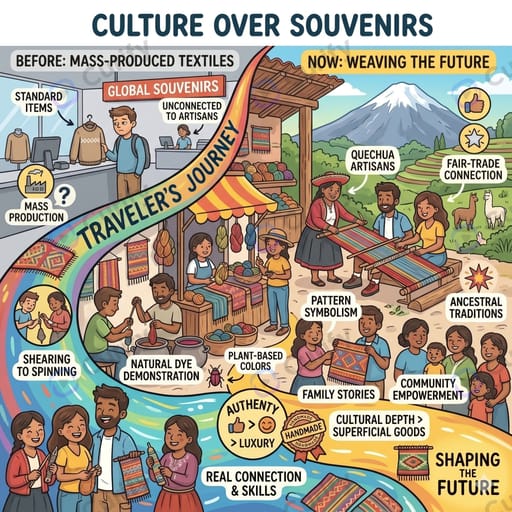
Cultural Travel Journey Infographic

Kid-Friendly Grid Fun-Fact Infographic
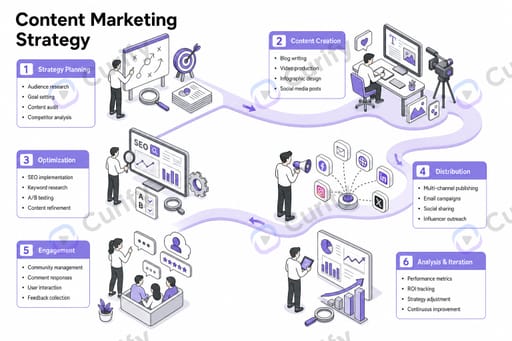
Isometric Business Process Roadmap Infographic
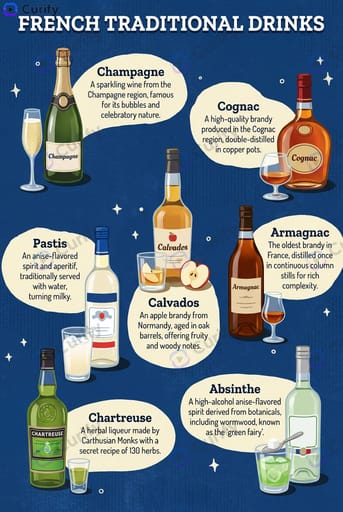
Regional Alcoholic Drinks Infographic
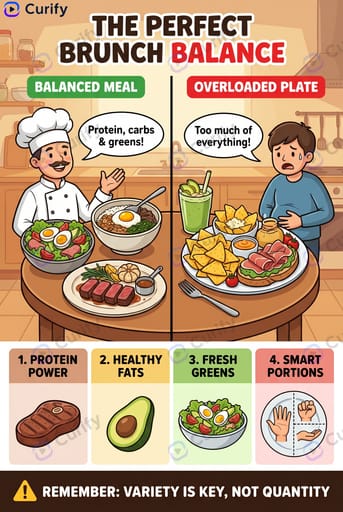
Food Recipe Tip Infographic
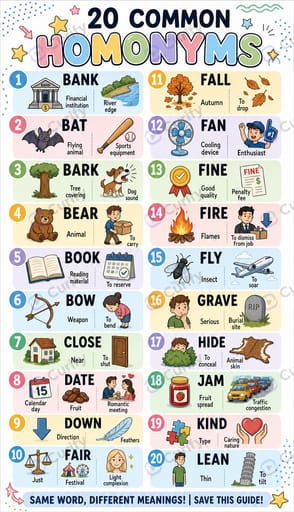
English Grammar Wordlist Infographic
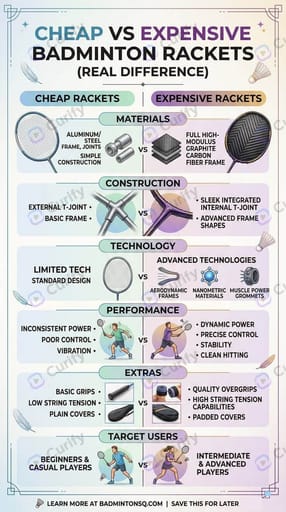
Two-Column Sports Comparison Infographic
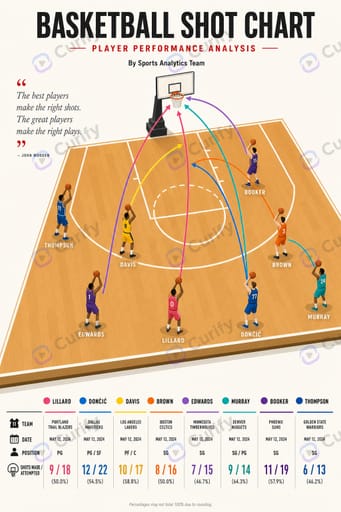
Sports Court Shot Trajectory Analysis Infographic
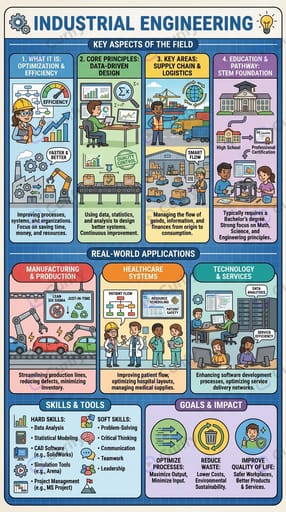
Career Field Infographic

Football Tournament Fixture Infographic

Yellow Journey Infographic
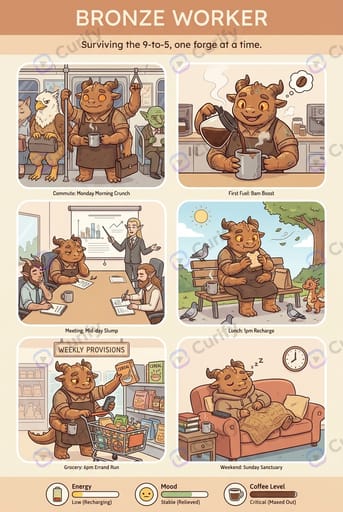
Original Character Daily Life Grid

Hairstyle Recommendation Infographic

Friends Character MBTI Posters
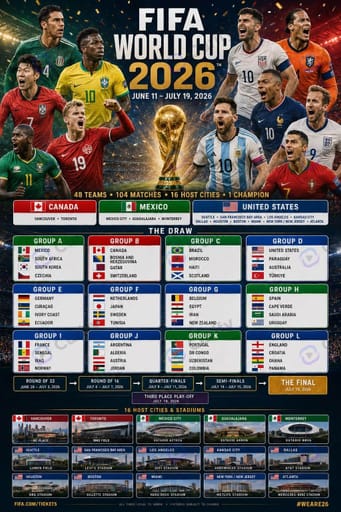
Sports Infographic
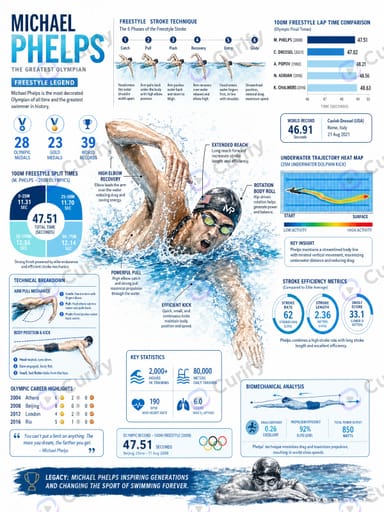
Pro Athlete Stat Infographic Poster
About this template
What is this template?
This template generates a vibrant, educational comparison infographic on a chosen finance topic. Split-screen layout contrasts two financial concepts with cartoon characters, simple icons, key statistics, and short takeaways. Warm colors with bold headings, clear typography, and approachable framing for beginner financial-literacy content.
Who should use it?
Suitable for personal-finance creators, financial-coaching coaches, neobank marketers building education campaigns, business publishers building money explainers, and high-school/college economics educators.
How to use it
- Pick a finance comparison topic (Saving vs Investing, Debt vs Assets, Employee vs Entrepreneur, Spending vs Budgeting, Active vs Passive Income).
- Generate the comparison infographic poster.
Example prompts
- Generate a Saving vs Investing finance comparison infographic.
- Create an Active vs Passive Income money infographic.
- Generate an Employee vs Entrepreneur comparison poster.