Join Curify to Globalize Your Videos
By using Curify, you agree to our
Terms of Service and Privacy Policy
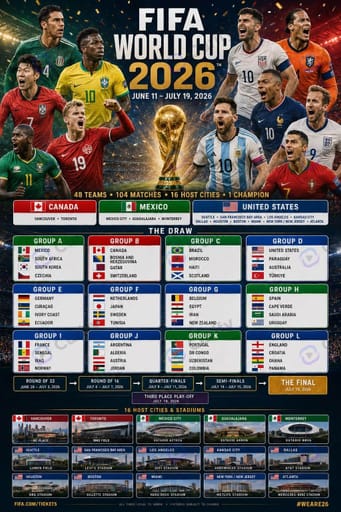
Nano Banana Prompt: Sports Court Shot Trajectory Analysis Infographic Generator
Generate a vertical tactical shot-map infographic — top-down/isometric court layout with color-coded curved trajectory lines from athlete positions to target zones, tiny cartoon player markers, and a full data table of attempts, success rates, and per-player metrics.
Reproduce this template
Use your inputs — the prompt preview updates instantly.
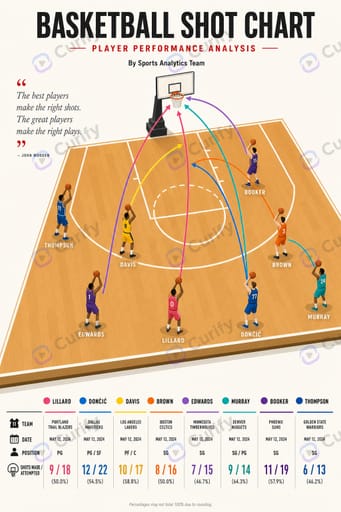
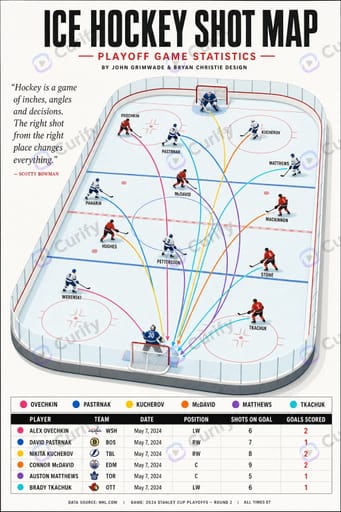
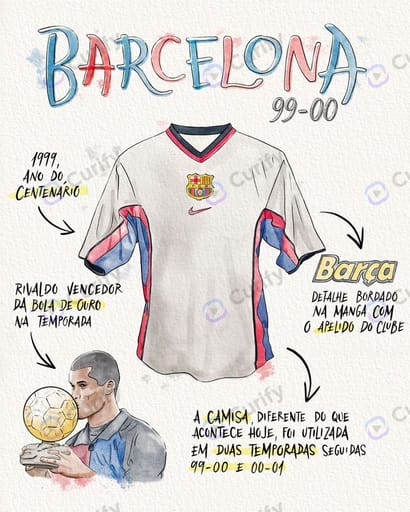
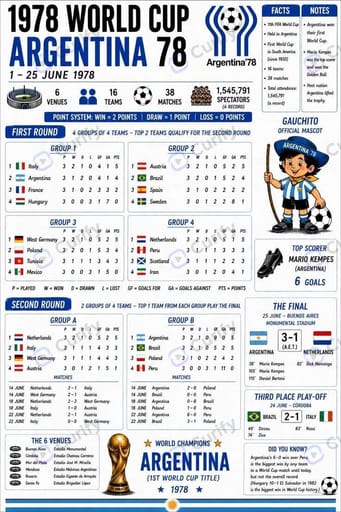
(Sports Court Shot Trajectory Tactical Analysis Infographic Poster Generator) Vertical tactical shot map infographic themed '{sport_analysis_topic}'. Layout: Large bold main title + quote text at top; full top-down/isometric official court floor layout in center; multiple colored curved trajectory lines originating from athlete positions to target zones, each line uniquely color-coded with index marker; tiny simplified cartoon player figures placed at each starting position; bottom complete data table including athlete name, team, match date, position, shot attempts, success rate and detailed metrics, unified color legend matching trajectory lines. Style: clean modern sports analytics graphic design, soft flat illustration court texture, distinct bright trajectory line colors, clear table typesetting, professional match tactical analysis print poster, ultra HD sharp vector graphics. Subject: complete match shot trajectory & performance stats analysis infographic poster for '{sport_analysis_topic}'.Other nano banana templates
Explore other categories and presets.


About this template
What is this template?
This template generates a vertical 8K tactical shot-trajectory infographic poster for any sport. Layout: bold main title + quote at top; full top-down or isometric official court floor at center; multiple uniquely color-coded curved trajectory lines originating from athlete positions to target zones, each labeled with an index marker; tiny simplified cartoon player figures at each starting position; bottom data table with athlete name, team, match date, position, shot attempts, success rate, and detailed metrics. Color legend ties trajectory lines to table rows. Clean modern sports-analytics graphic design, soft flat illustration court texture, distinct bright trajectory colors, professional print-poster quality.
Who should use it?
Suitable for sports analysts producing match-review collateral, coaches teaching shot selection / tactical patterns, sports-media designers needing data-viz posters, fantasy-sports content creators, and broadcast-graphics producers.
How to use it
- Enter the sport + analysis focus in {sport_analysis_topic} (e.g. 'NBA player full-court shot point hit-rate visualization chart').
- Top-down / isometric court auto-renders for the matching sport.
- Color-coded trajectories + cartoon player markers + data table auto-compose.
- Generate a vertical 8K shot-trajectory tactical analysis infographic.
Example prompts
- Generate a soccer long-range volley shot trajectory tactical analysis poster.
- Create an NBA player full-court shot point hit-rate visualization chart.
- Generate a tennis serve placement line-route grand-slam technique analysis infographic.