Join Curify to Globalize Your Videos
or
By using Curify, you agree to our
Terms of Service and Privacy Policy
Declining Fertility Rate — Hot Event Analysis Infographic
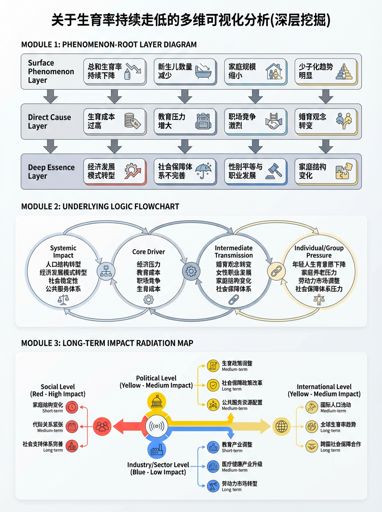
This engaging infographic illustrates the trends and implications of the declining fertility rate, providing a multidimensional analysis. Creators and educators can utilize this example to better understand demographic shifts and their societal impact. Leverage our AI generator to create your own insightful analysis on this critical topic.
Generate your own
Event Title (for main title)
Underlying Logic Chain (connect with →)
Impact Radiation Direction
Prompt
Generate a visual infographic on hot events: portrait 3:4; text in English with clear and separate layers; white background. Title: Multi-dimensional visual analysis with AI — 【{event_title}】 (in-depth exploration). Content structure: 1) Phenomenon-Essence Layered Diagram: from top to bottom “Surface Phenomenon Layer → Direct Cause Layer → Deep Essence Layer,” with arrows indicating causal relationships; 2) Underlying Logic Breakdown Diagram: process chain “{logic_chain},” labeling subjects, actions, and results; 3) Long-term Impact Radiation Diagram: radiating from the event towards {impact_axes}, labeling impact content and duration (short/medium/long), using colors to distinguish impact levels (red high/yellow medium/blue low).Use this example for
More like this


Other nano banana templates
Explore other categories and presets.