Join Curify to Globalize Your Videos
By using Curify, you agree to our
Terms of Service and Privacy Policy
Global City Walkability Infographic Card Generator
Generate a grid-layout walkability infographic poster for any list of global cities — flags, landmark photos, walkability scores, and pedestrian-first urban design highlights.
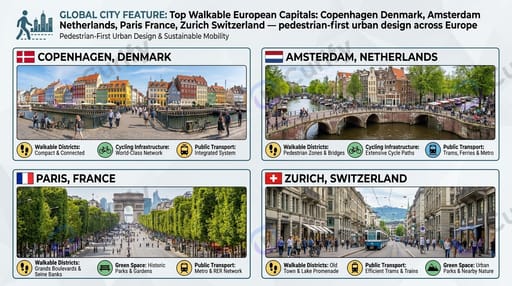
Top walkable European capitals: Copenhagen Denmark, Amsterdam Netherlands, Paris France, Zurich Switzerland — pedestrian-first urban design across Europe
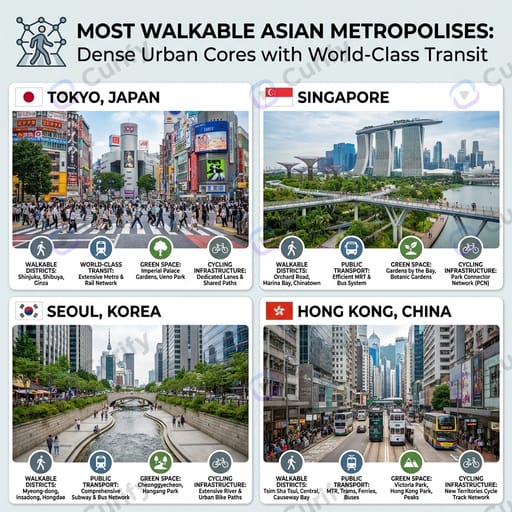
Most walkable Asian metropolises: Tokyo Japan, Singapore, Seoul Korea, Hong Kong China — dense urban cores with world-class transit
Reproduce this template
Use your inputs — the prompt preview updates instantly.
(Global City Feature Infographic Creator) Grid layout urban feature infographic poster themed '{city_list_info}'. Layout: Multiple equal rectangular city card panels arranged in neat grid, every single city panel: top left small national flag + bold city&country title, middle large realistic panoramic landmark cityscape photo of local iconic architecture and pedestrian street scene, bottom row of circular icon + short descriptive text labels highlighting city core features like walkable districts, public transport, green space, cycling infrastructure; Optional top global headline banner with intro icon and theme subtitle for full infographic. Style: Clean modern infographic design, subtle dark or bright customizable background, crisp border segmentation for each city tile, high detail photorealistic city scenery, clear sans-serif typography, vibrant natural city color grading, 8K high definition print quality, flexible grid auto-adapts based on input city quantity. Subject: Walkable city feature showcase infographic for {city_list_info}.Other nano banana templates
Explore other categories and presets.

Yellow Journey Infographic

Fruit Commercial Lifestyle Infographic Poster

Sports Infographic

Souvenir Watercolor Poster

Regional Alcoholic Drinks Infographic

Music Style Visual Infographic

Wine Variety Introduction Infographic

Tourist Spot Watercolor Map Infographic

Dessert Color Lab Infographic

Classic Spirits Cocktail Recipe Grid Poster

Original Character Daily Life Grid

Red Envelope Set Showcase

Football Tournament Fixture Infographic

International Event Promotional Poster

World Cup Group Banner Poster

World Cup Debut Team Preview

World Landmark Vintage Poster

Pet Life Journey Infographic
About this template
What is this template?
This template generates a vertical 4K grid-layout walkability infographic poster for any list of global cities. Each city panel features a small national flag, bold city/country title, large realistic panoramic landmark cityscape, walkability score, and key pedestrian-first urban design highlights. Layout works for 4-9 cities per poster.
Who should use it?
Suitable for urban planners, travel content creators, sustainable mobility advocates, real estate agents specializing in walkable neighborhoods, expat content publishers, and city tourism boards.
How to use it
- Enter a comma-separated city list in {city_list_info} (e.g., Copenhagen Denmark, Amsterdam Netherlands, Paris France).
- Each city auto-populates with flag, landmark cityscape, walkability score, and key features.
- Grid layout adjusts based on number of cities (4-9 typical).
- Generate a vertical 4K walkability infographic poster.
Example prompts
- Generate a walkability infographic for European capitals: Copenhagen, Amsterdam, Paris, Zurich.
- Create a walkable Asian metropolises poster: Tokyo, Singapore, Seoul, Hong Kong.
- Generate a walkable American cities infographic: NYC, San Francisco, Boston, Chicago.