Join Curify to Globalize Your Videos
By using Curify, you agree to our
Terms of Service and Privacy Policy
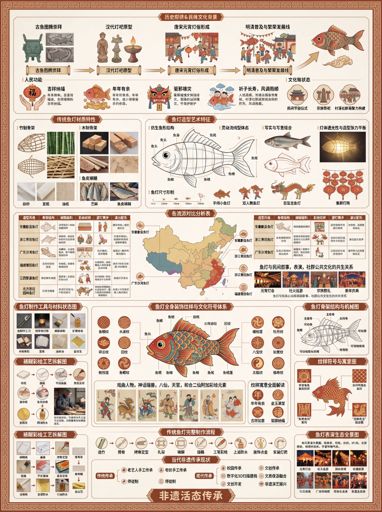
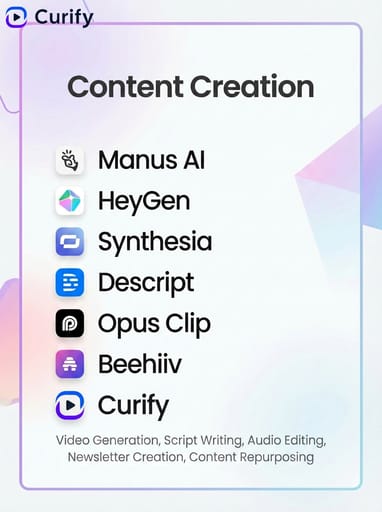
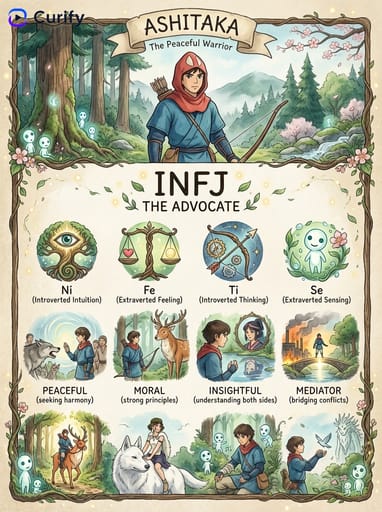
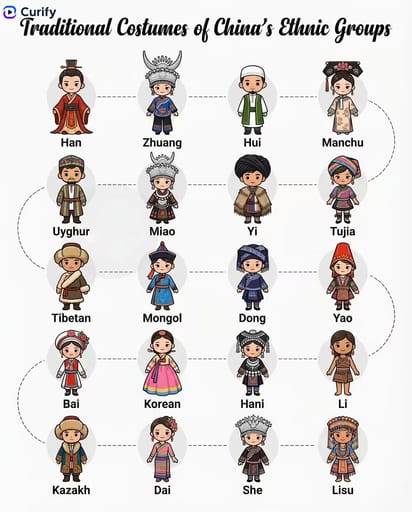
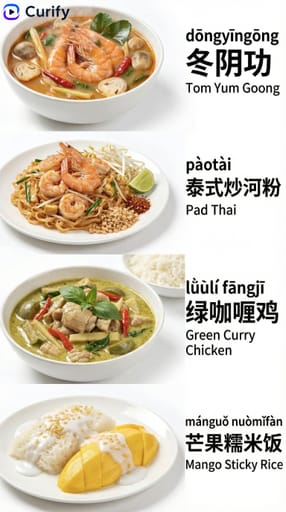
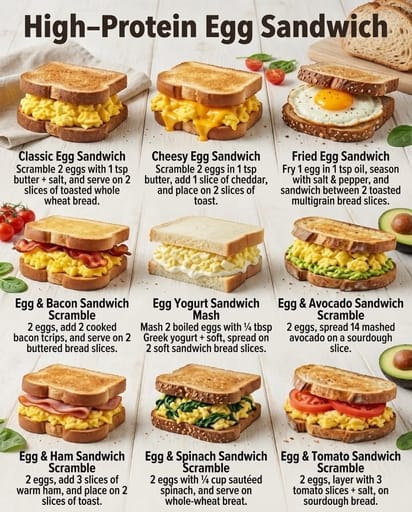
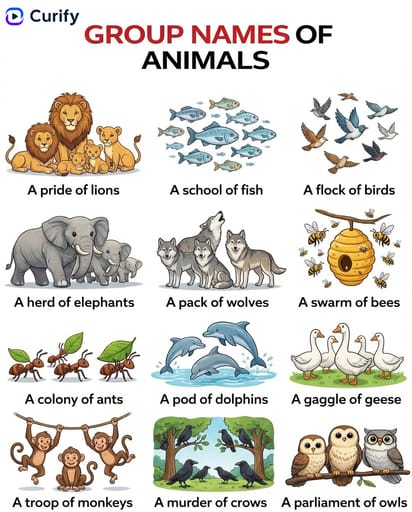
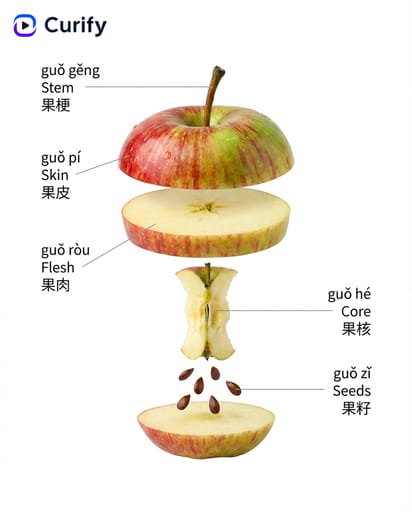
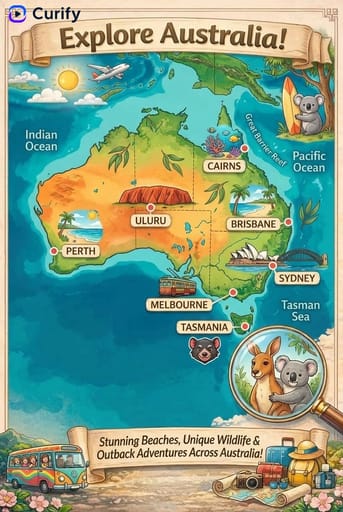
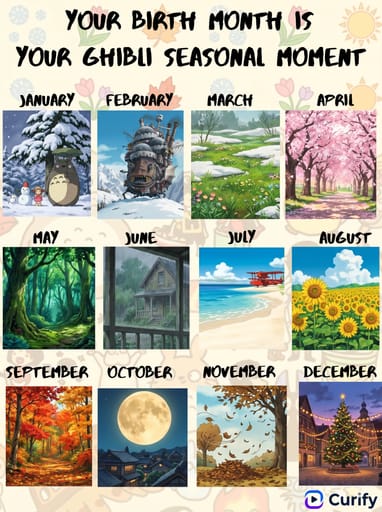
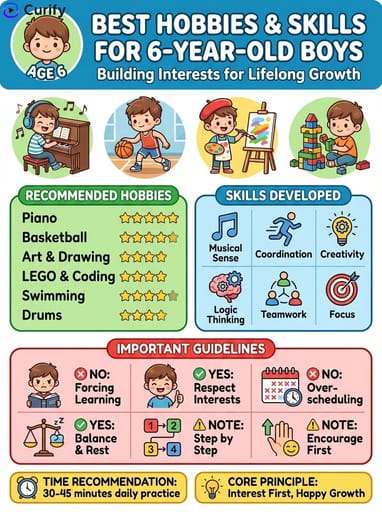
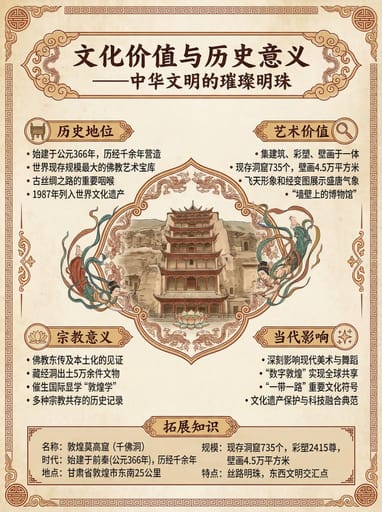
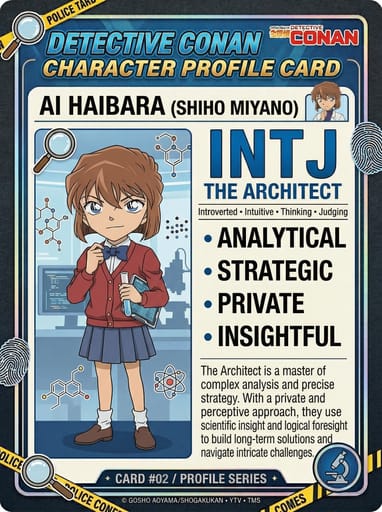
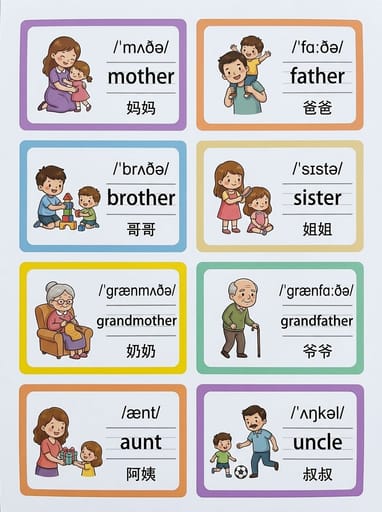
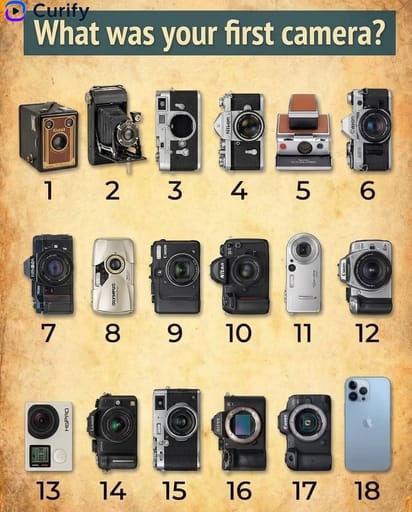
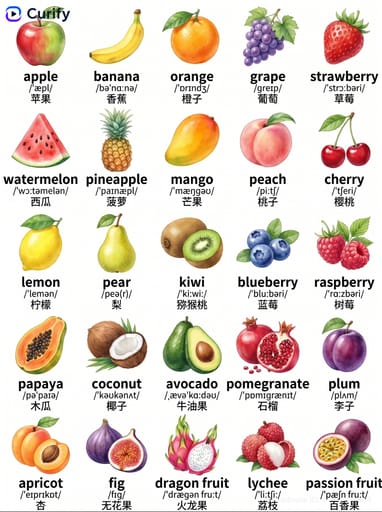
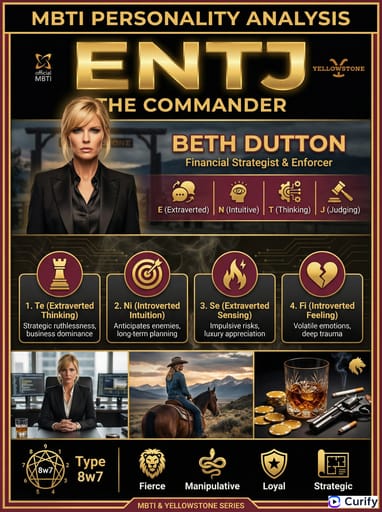
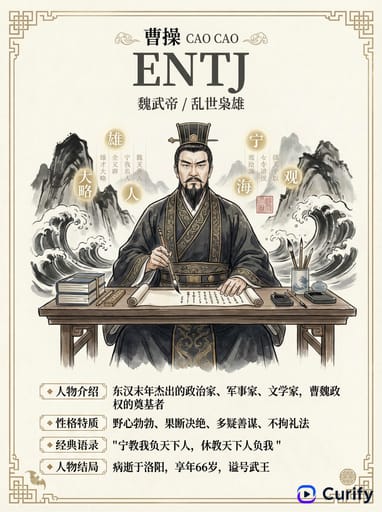
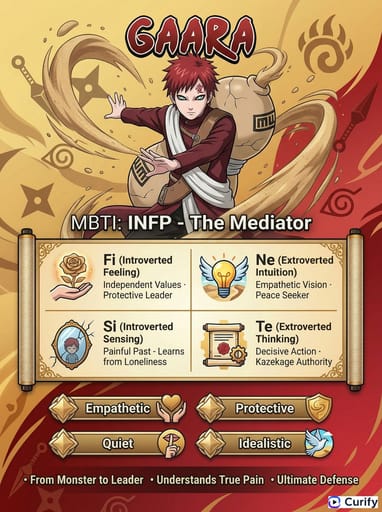
Example Images

Reproduce this template
Use your inputs — the prompt preview updates instantly.
(Modular Infographic Designer) You are a top-tier modular infographic designer specializing in creating cohesive multi-card visual series. The user has specified [{series_topic}] in [{art_style}].
First, reason about {series_topic} and determine: a logical set of section titles that together form a coherent narrative series — such as Cover, Overview, Key Concepts, Comparison, Case Study, Future Outlook, etc. — adapted to the nature of the topic (business, science, culture, education, etc.).
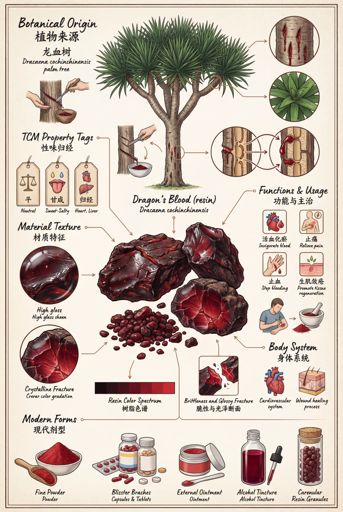
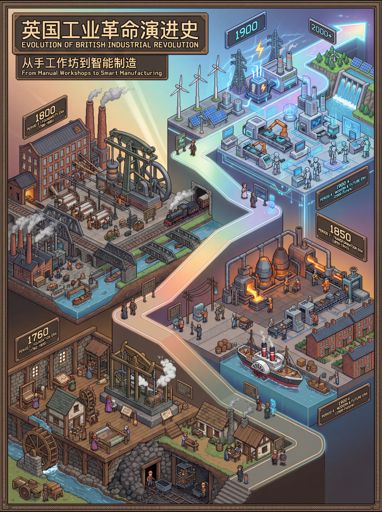
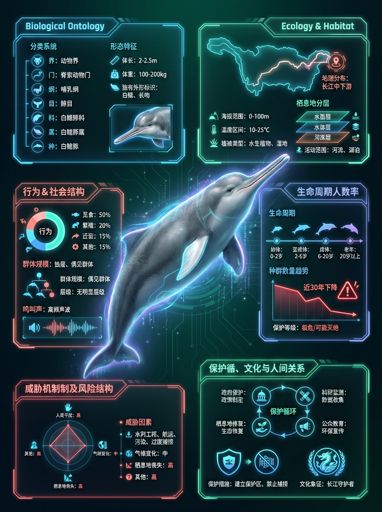
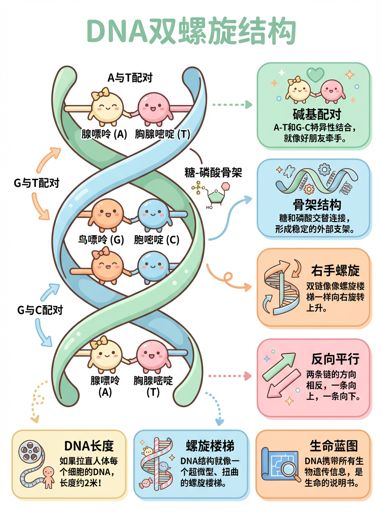
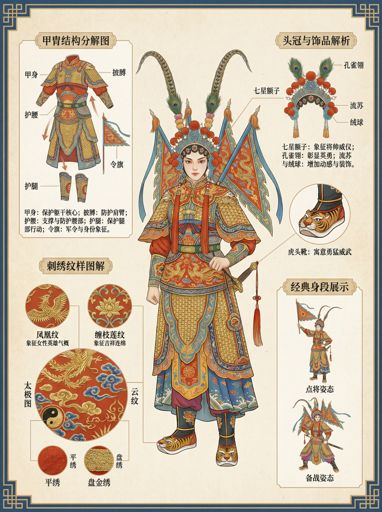
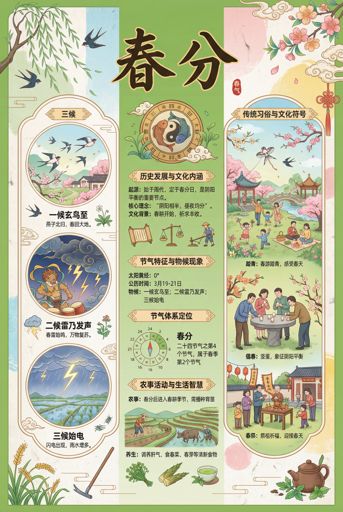
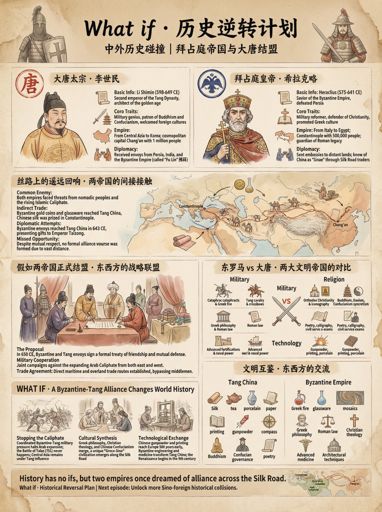
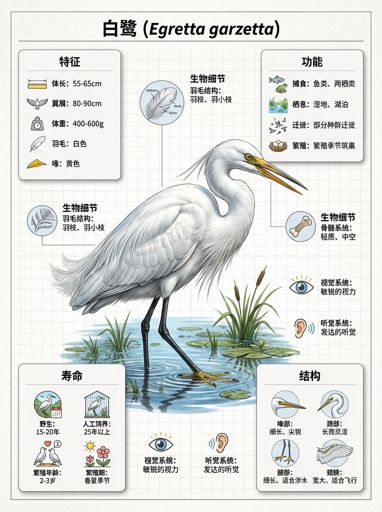
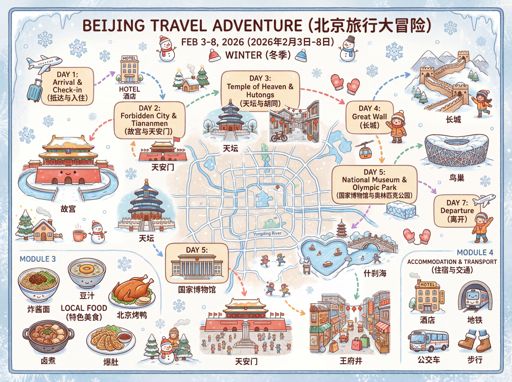
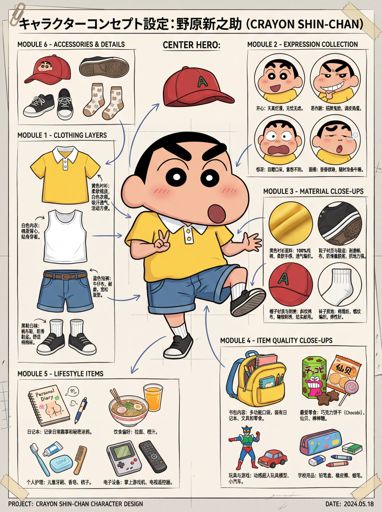
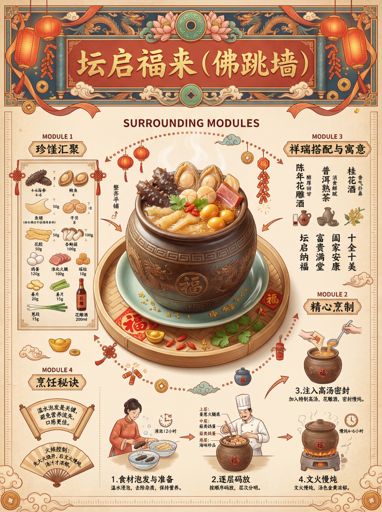
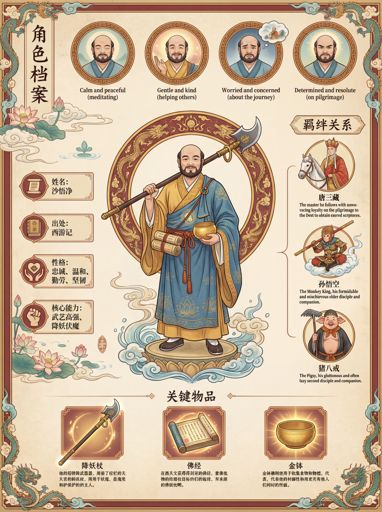
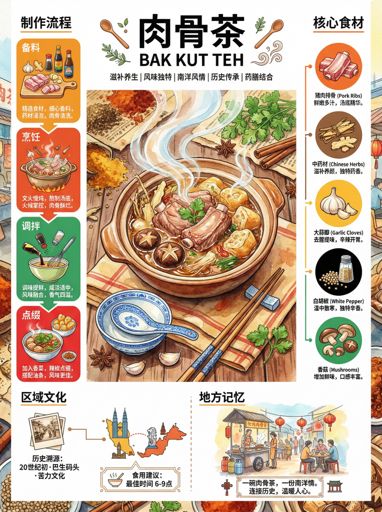
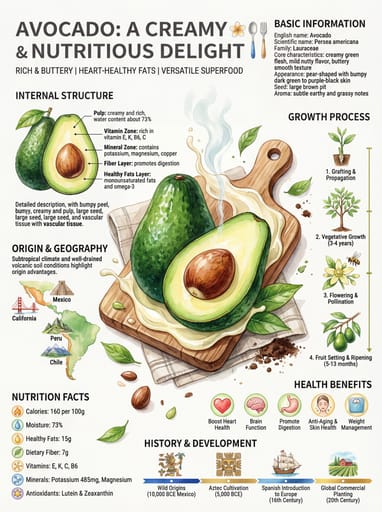
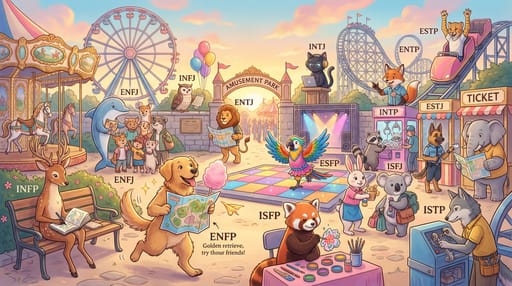
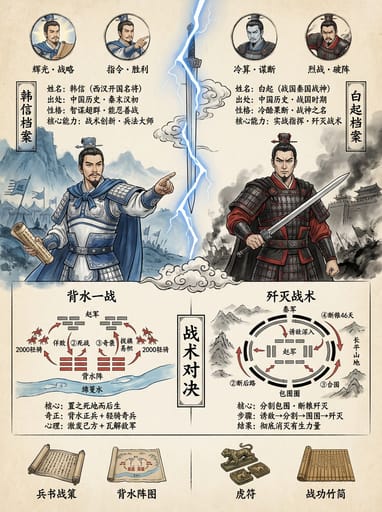
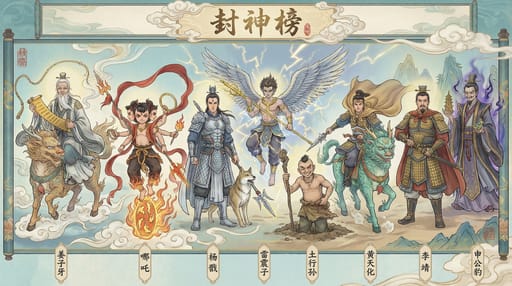
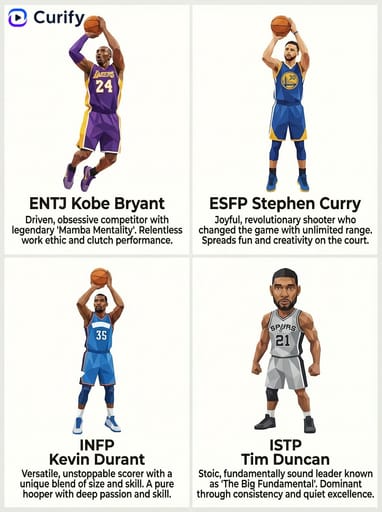
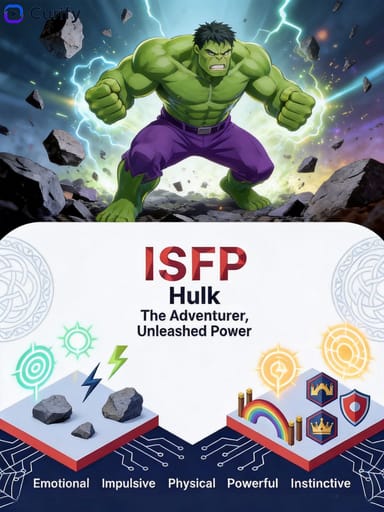
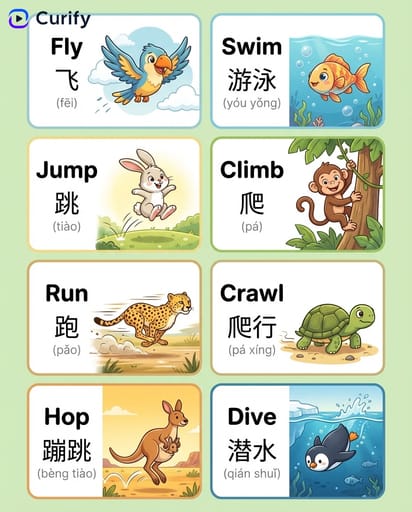
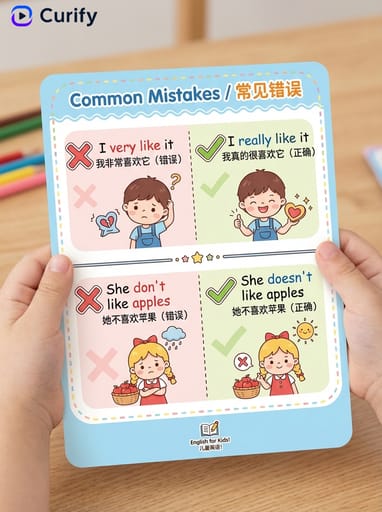
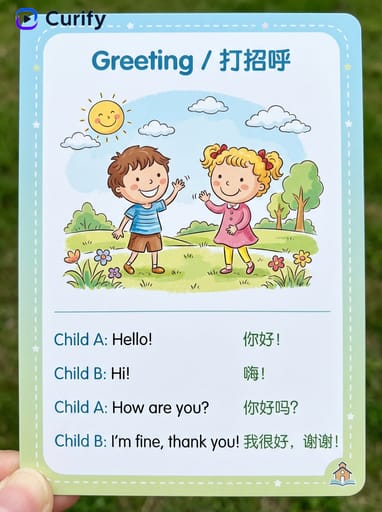
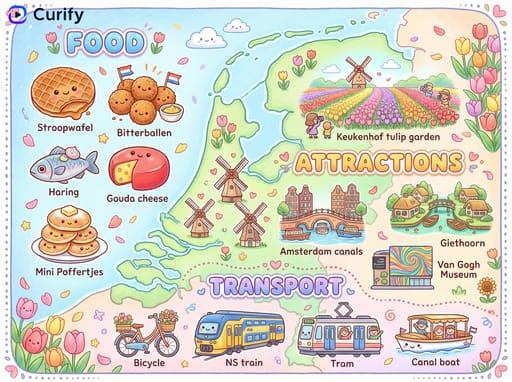
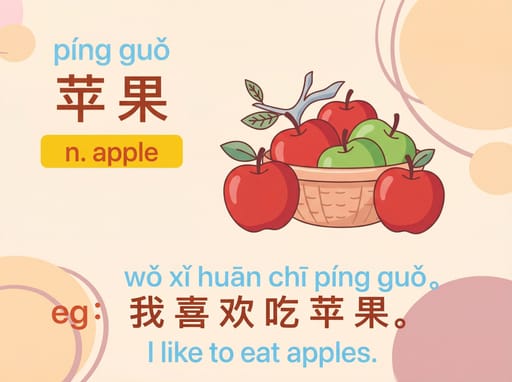
Then generate a complete set of vertical 3:4 high-quality infographic cards. Each card focuses on one core section while maintaining consistent visual language. Single card structure: 1. Top title bar: prominent section title with soft themed background and rounded corners. 2. Central visual: core illustration/diagram representing the concept (comparison, timeline, flowchart, character, or scene) in {art_style}. 3. Content modules: layout with sections containing "icon + label + short description". 4. Bottom summary: highlighted box with key takeaway. Style: clean rounded UI, soft colors, clear typography, no extra decoration, Curify watermark top-left, vertical 3:4, 4K ultra HD. Series topic: [{series_topic}].Other nano banana templates
Explore other categories and presets.


About this template
What is this template?
This template generates a cohesive series of infographic cards, each representing a chapter of a larger topic. The design follows a consistent visual system with structured sections such as title, central illustration, modular content blocks, and summary highlights. It is optimized for storytelling across multiple cards with clarity and visual continuity.
Who should use it?
Suitable for educators, content creators, business storytellers, startup analysts, product explainers, science communicators, and social media creators producing multi-part educational or narrative content.
How to use it
- Define a series topic (e.g., AI trends, lifecycle processes, cultural systems).
- Break the topic into structured sections or chapters.
- Assign a visual style (e.g., flat illustration, cartoon, watercolor, tech diagram).
- Design each card with a title, central visual, and modular explanation blocks.
- Add a highlighted summary or takeaway at the bottom of each card.
Example prompts
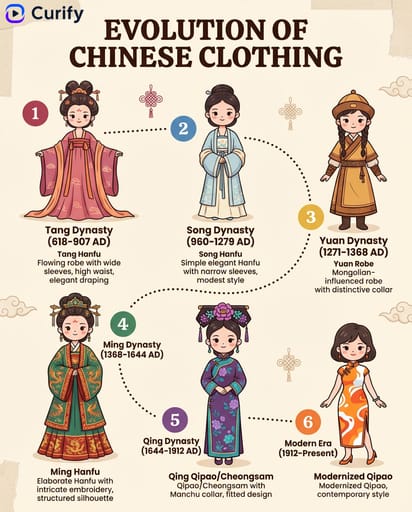
- Create a series infographic on 'The Lifecycle of a Butterfly' with sections: Overview, Egg Stage, Larva Stage, Pupa Stage, Adult Stage, and include soft pastel illustrations.
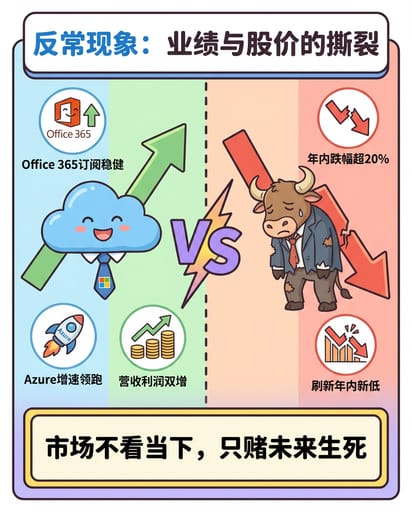
- Generate a multi-card infographic for 'Microsoft's AI Strategy Challenges' with sections on strategy, competition, partnerships, risks, and future outlook in a clean tech illustration style.
- Create a series infographic on 'Emotional Intelligence Guide' with chapters on awareness, regulation, empathy, communication, and growth, using friendly cartoon visuals.