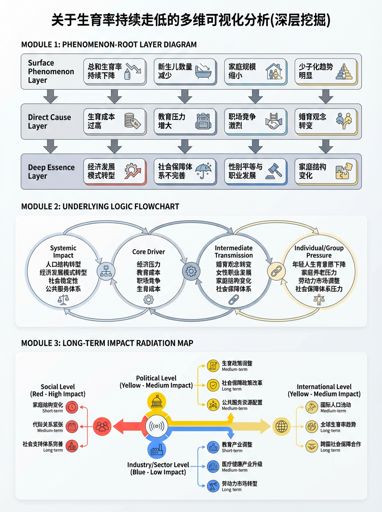
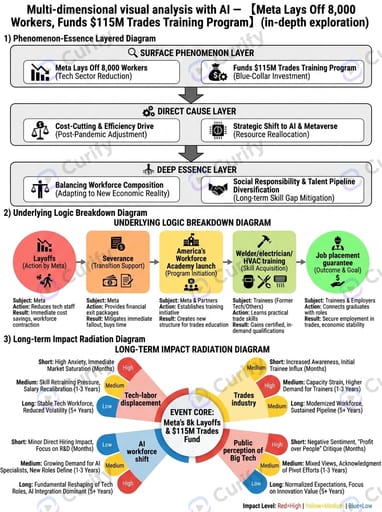
Generate a visual infographic on hot events: portrait 3:4; text in English with clear and separate layers; white background. Title: Multi-dimensional visual analysis with AI — 【Meta Lays Off 8,000 Workers, Funds $115M Trades Training Program】 (in-depth exploration). Content structure: 1) Phenomenon-Essence Layered Diagram: from top to bottom “Surface Phenomenon Layer → Direct Cause Layer → Deep Essence Layer,” with arrows indicating causal relationships; 2) Underlying Logic Breakdown Diagram: process chain “Layoffs → Severance → America's Workforce Academy launch → Welder/electrician/HVAC training → Job placement guarantee,” labeling subjects, actions, and results; 3) Long-term Impact Radiation Diagram: radiating from the event towards Tech-labor displacement, Trades industry, AI workforce shift, Public perception of Big Tech, labeling impact content and duration (short/medium/long), using colors to distinguish impact levels (red high/yellow medium/blue low).