What is Infographics and How Can Infographic Cards Be Used?
What is Infographics and How Can Infographic Cards Be Used?
Infographics are not limited to education—they are a cross-medium way of structuring and distributing information, spanning both digital content and physical artifacts. They operate across two dimensions: digital-native usage for blogs, social media, and knowledge sharing, and physical-world usage for posters, exhibitions, and cultural visuals.
Understanding Infographics
Infographics are visual representations of information, data, or knowledge intended to present complex information quickly and clearly. They combine design, writing, and analysis to create engaging visual content that tells a story or explains a concept.
Visual Elements
Icons, charts, images, and illustrations
Content Elements
Text, statistics, facts, and explanations
Design Elements
Layout, color, typography, and hierarchy
Digital-Native Usage
Technical Blog Posts
Transform complex technical concepts into visually digestible infographics that enhance reader understanding and engagement.
Social Media Content
Create shareable infographic cards that communicate key information quickly and drive engagement across platforms.
Educational Materials
Develop comprehensive learning materials that combine visual elements with structured information for better retention.
Business Presentations
Enhance presentations with professional infographics that communicate data and concepts more effectively than text alone.
Physical-World Usage
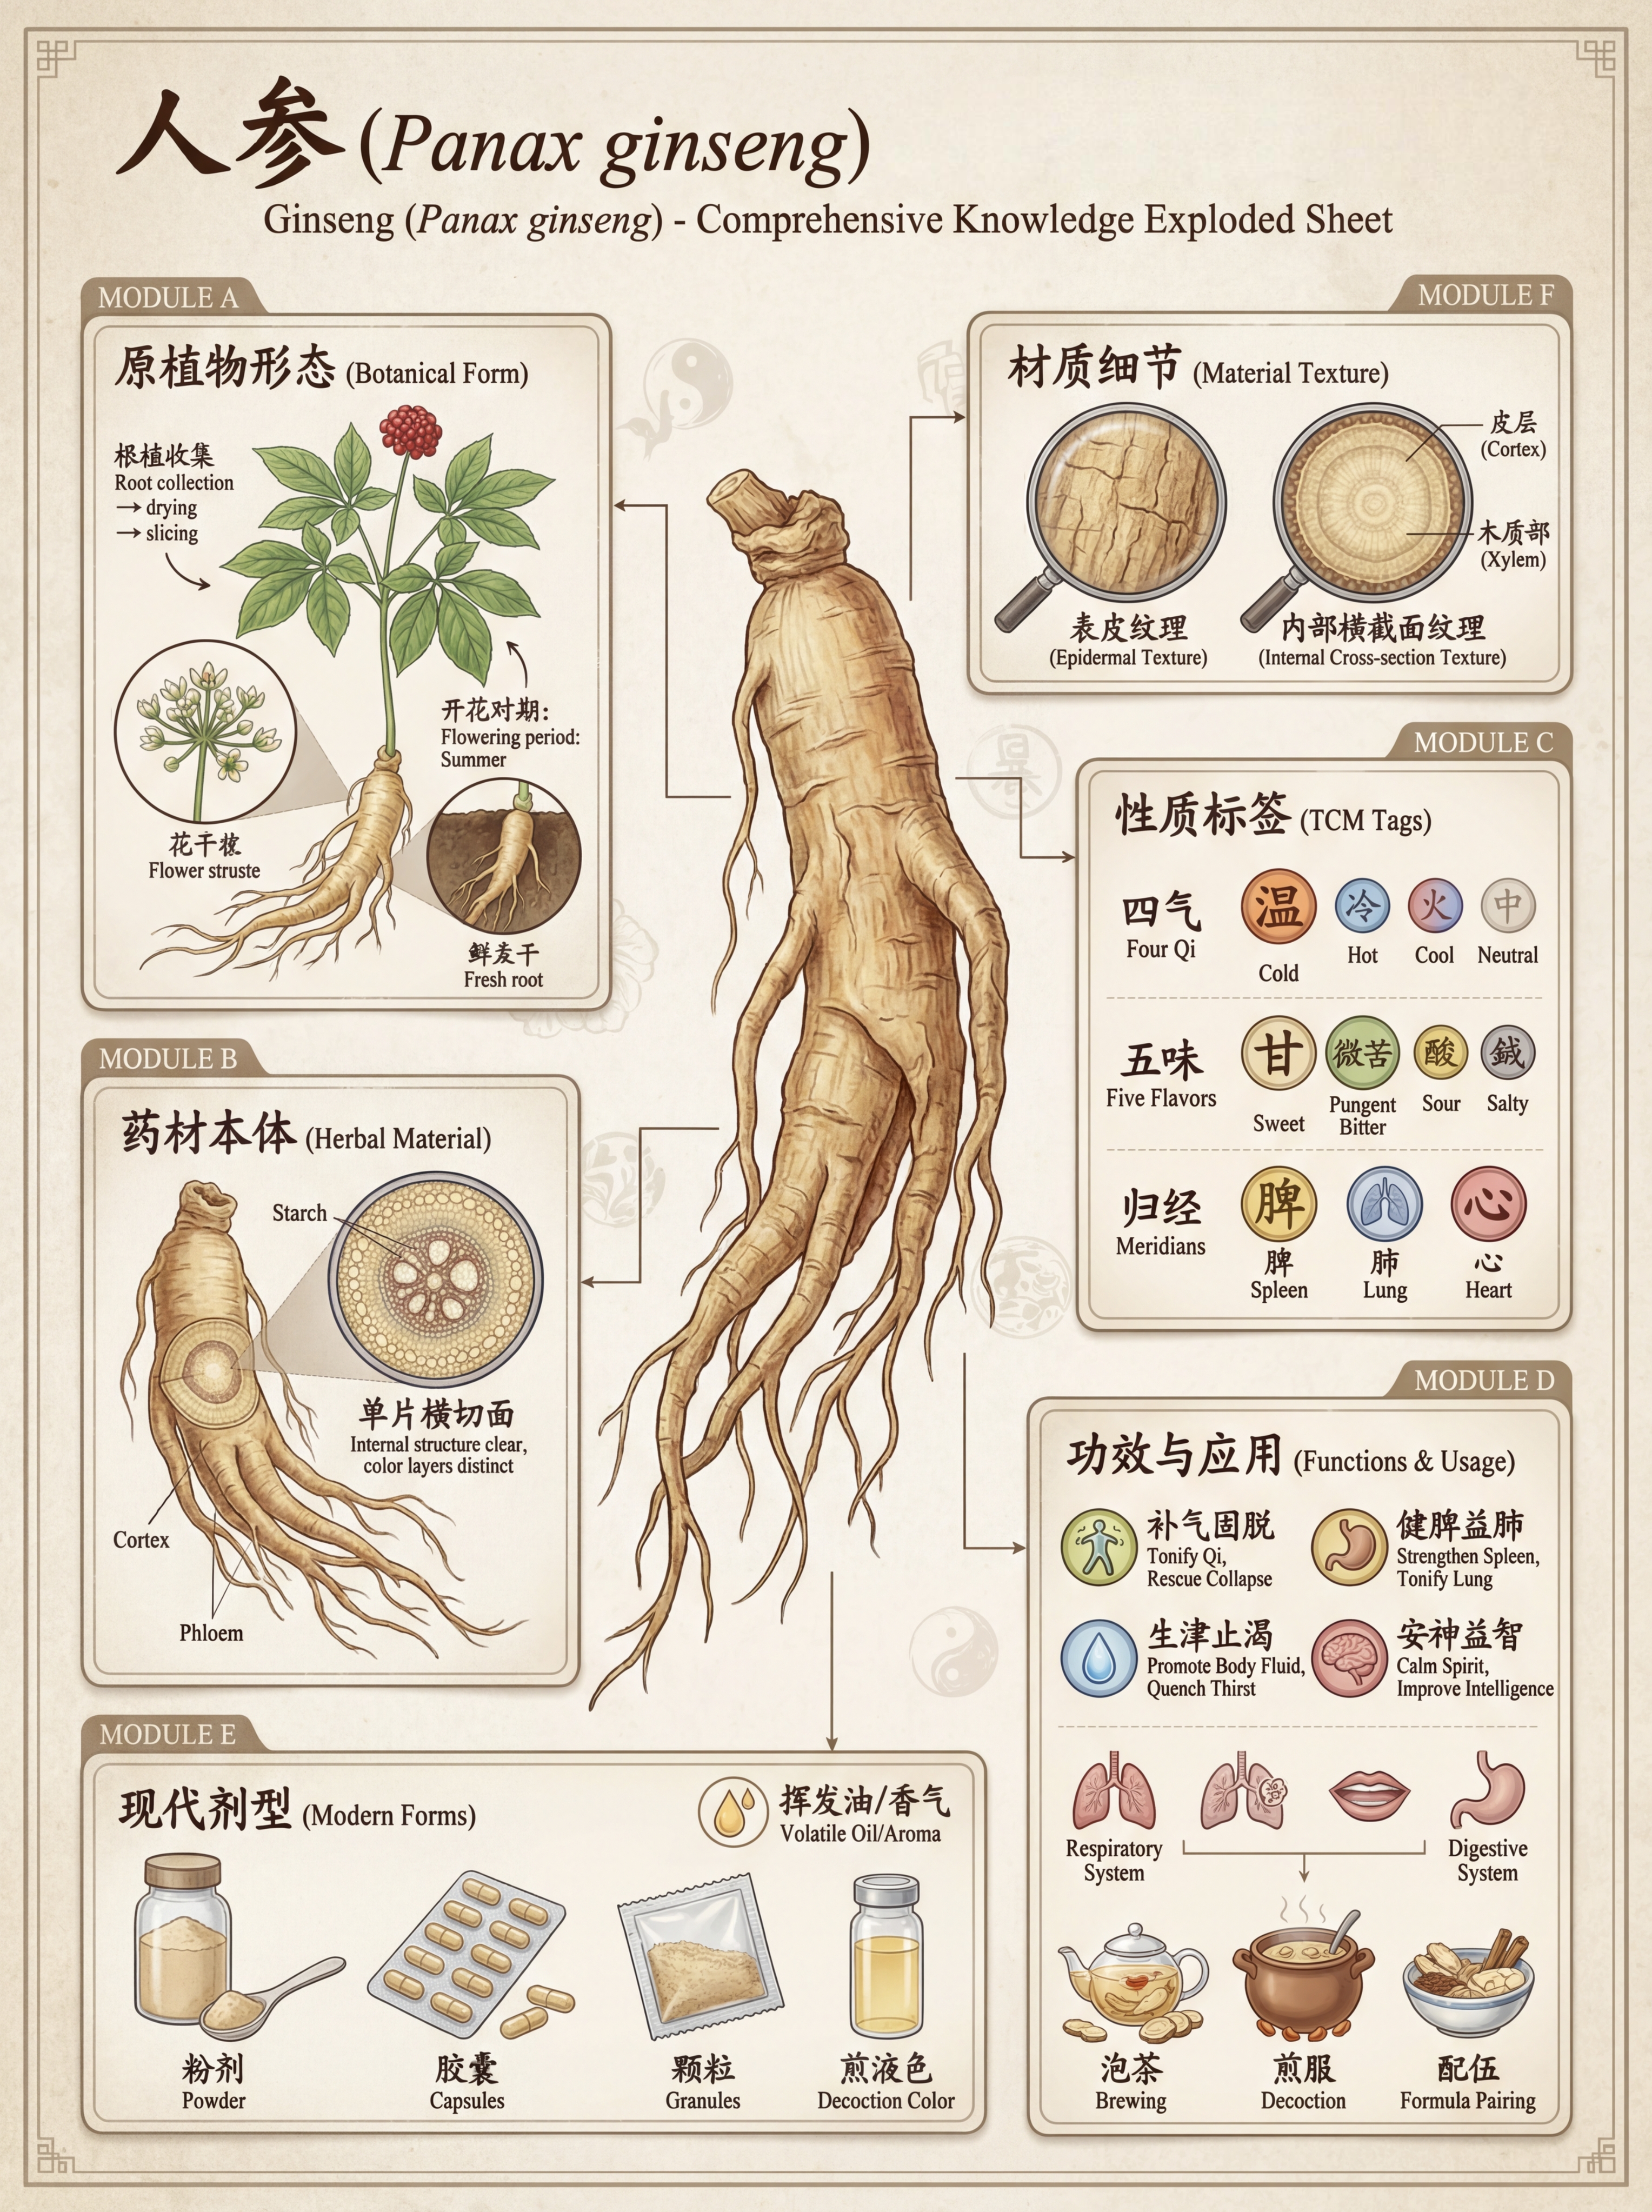
Traditional Medicine Posters
Create culturally relevant posters that blend traditional knowledge with modern infographic design principles.
Movie-Style Posters
Design promotional materials that combine cinematic aesthetics with informational infographics for events and exhibitions.
Educational Posters
Print large-format educational infographics for classrooms, museums, and public spaces.
Cultural Exhibitions
Design exhibition materials that tell stories through visual information and cultural narratives.
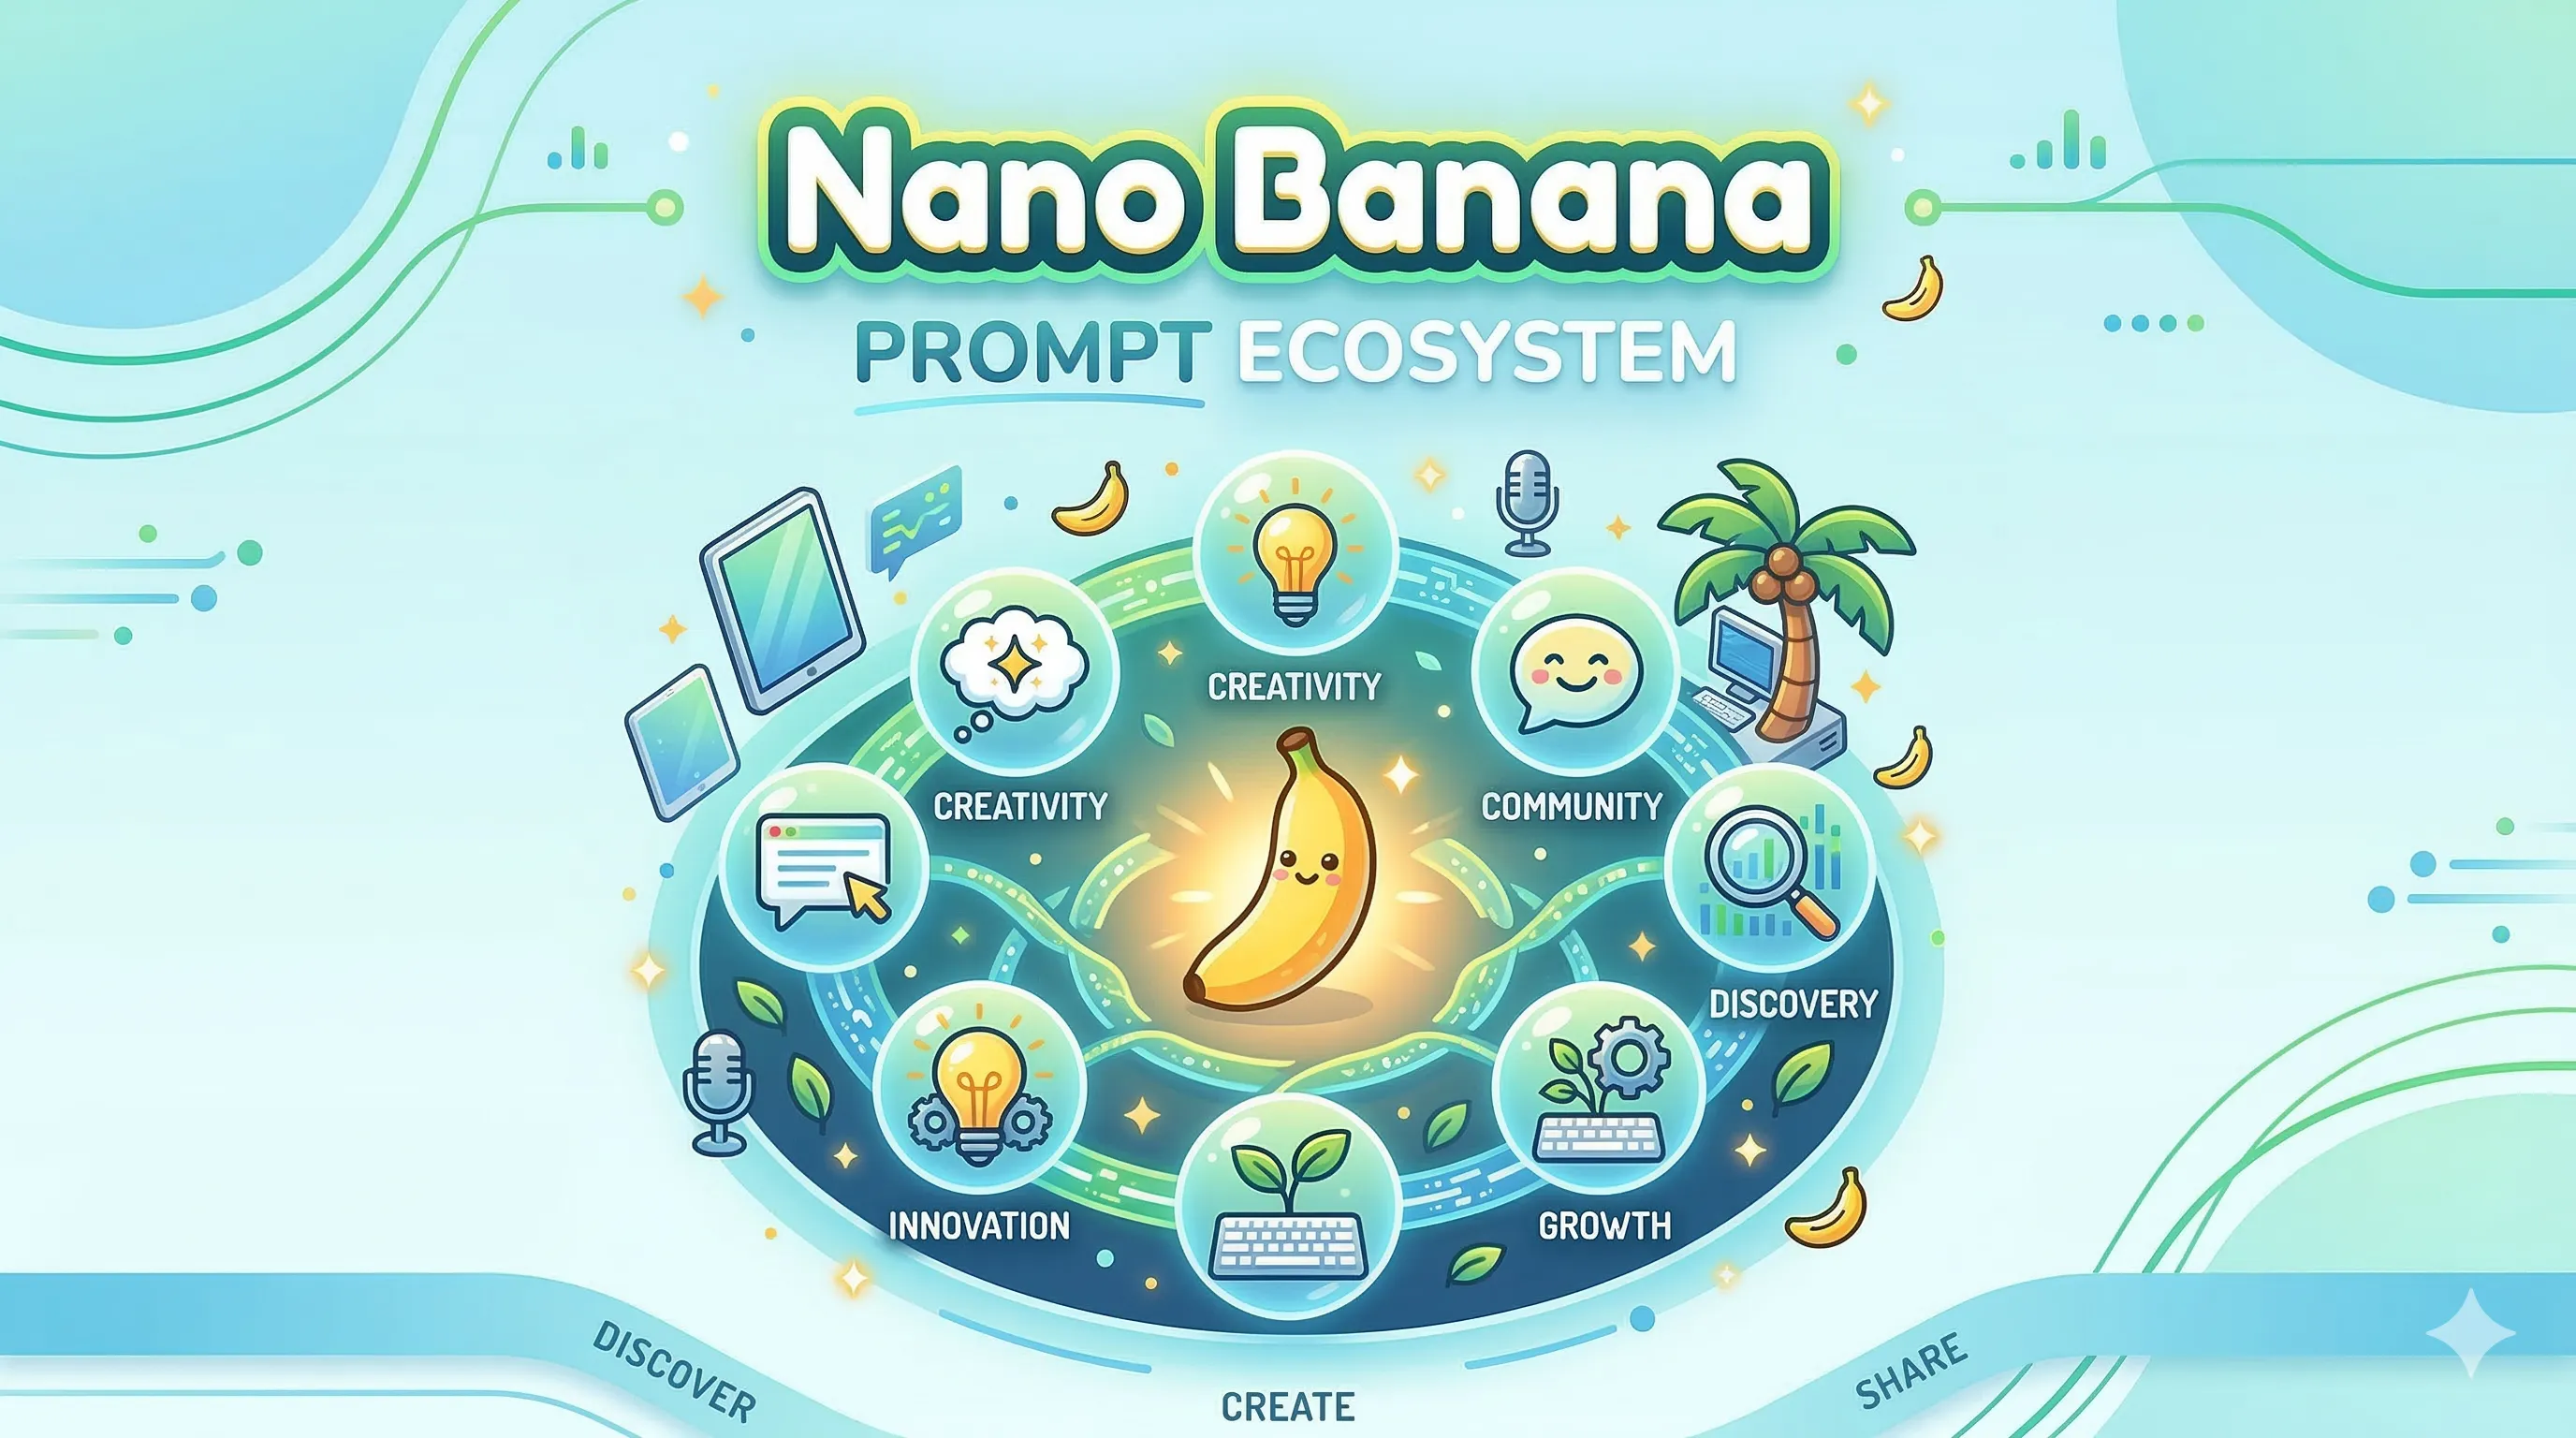
Connecting with Nano Banana Prompts & Templates
Nano Banana prompts and templates provide a structured approach to creating infographics that bridge both digital and physical applications. Our ecosystem offers specialized templates for various infographic use cases.
Chinese Herbal Medicine Guide
Structured visual guide combining traditional medicine knowledge with modern infographic design
Evolution Timeline Visualization
Historical progression displayed through connected visual elements and chronological data
Cultural Costume History
Fashion evolution presented through cultural context and visual transformation
Key Insights & Observations
Educational Dominance
Educational and research-related scenarios are indeed the dominant use case for infographics, but the space is still under-explored and evolving rapidly.
Cross-Medium Potential
The most successful infographic applications recognize that digital and physical are not the same product problem—they require different approaches and considerations.
Structured Information
Infographics excel at making complex information accessible through visual hierarchy, structured layouts, and the strategic use of color and typography.
Nano Banana Prompt Examples for Infographics
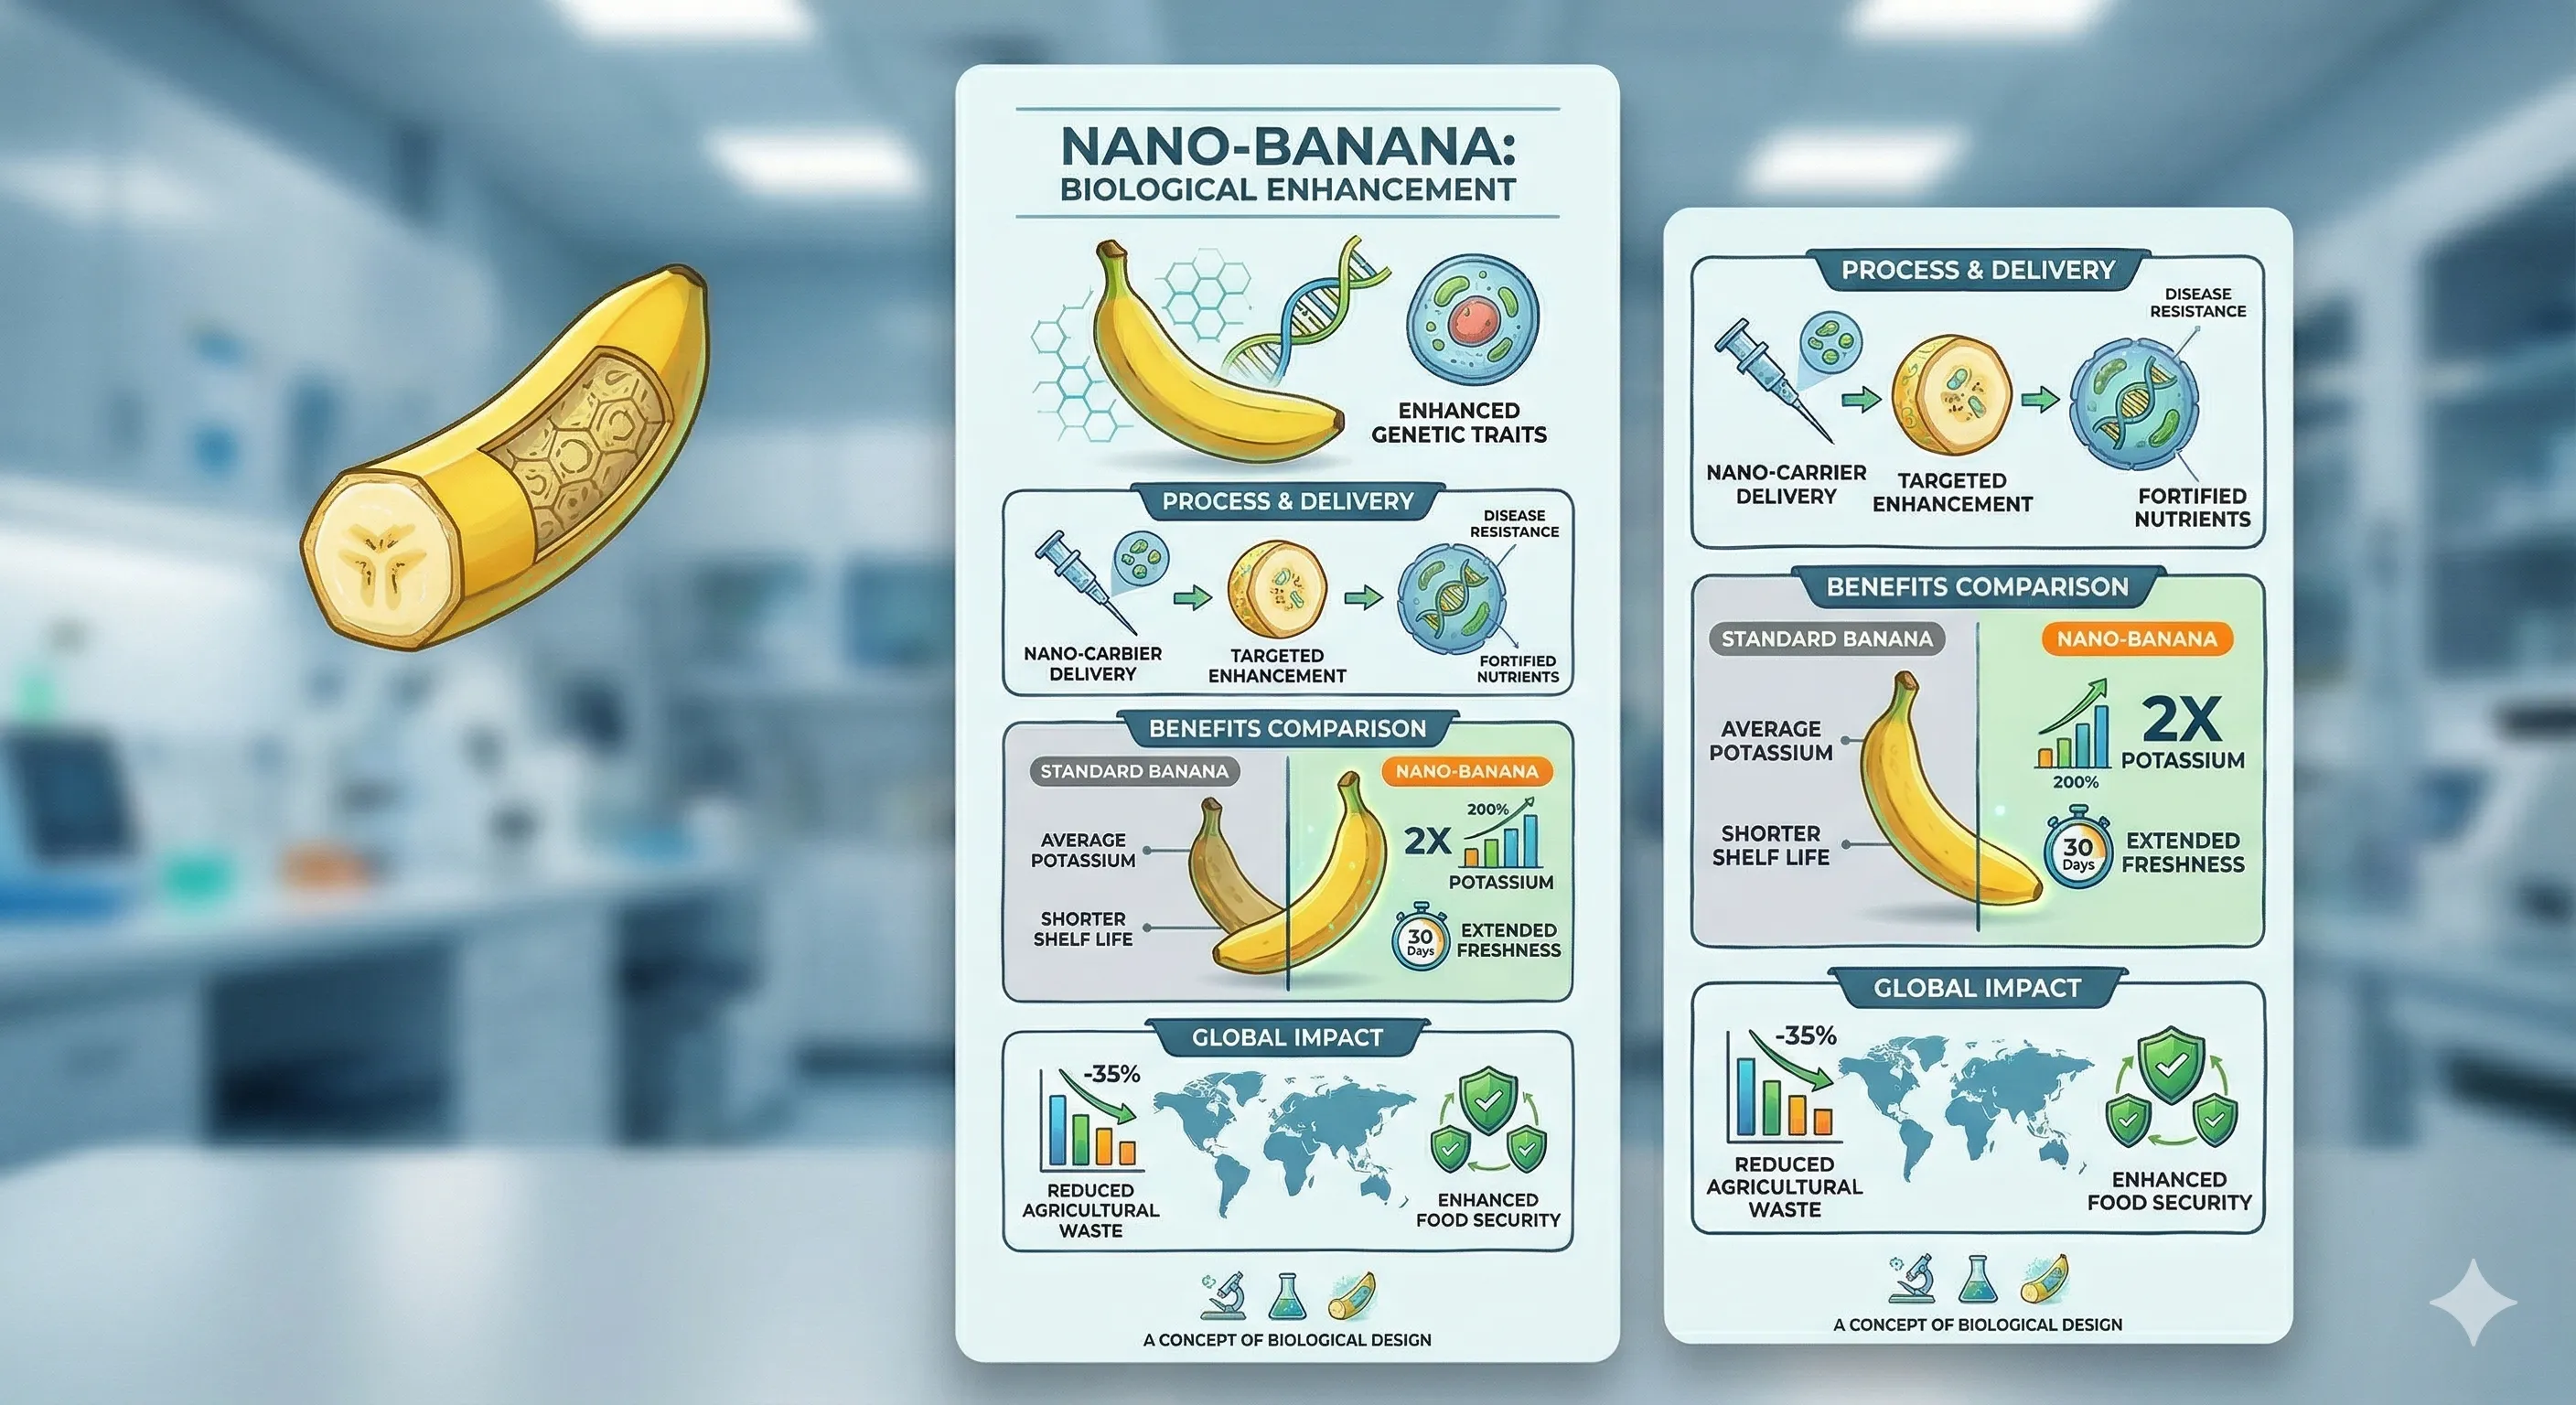
Technical Blog Post Infographic
Use this prompt to create technical infographics for blog posts, documentation, or educational content.
Cultural Heritage Infographic
Perfect for creating cultural education materials, museum displays, or heritage preservation content.
Business Data Infographic
Ideal for business presentations, annual reports, or corporate communications.
The Future of Infographics
Emerging Trends
- •Interactive infographics with dynamic data visualization
- •AI-powered infographic generation and customization
- •AR/VR integration for immersive infographic experiences
- •Real-time data integration for live infographic updates
Growth Opportunities
- •Educational technology and e-learning platforms
- •Content marketing and brand storytelling
- •Data journalism and news media visualization
- •Corporate training and internal communications
Conclusion
Infographics represent a powerful medium for information communication that transcends traditional boundaries between digital and physical applications. By leveraging structured visual design and the power of Nano Banana prompts and templates, creators can develop compelling infographics that serve diverse purposes—from technical documentation to cultural preservation. As the field continues to evolve with new technologies and applications, the fundamental principle remains clear: effective infographics make complex information accessible, engaging, and memorable across all mediums.
Take the next step
Putting what you read into practice.
Browse related topics
More templates and prompts in these areas.
Related Articles
Learning & Education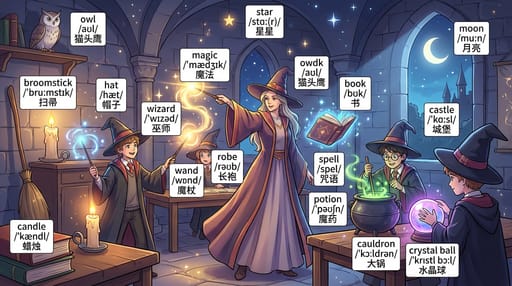
Visual Learning: AI Tools, Flashcards, and Infographics for Modern Classrooms
The Curify Nano Banana Prompt Library: 4,000+ Tested Image Prompts