Series Infographics vs Google NotebookLM: Visual vs Narrative Content
Series Infographics vs Google NotebookLM: A Visual vs Narrative Approach
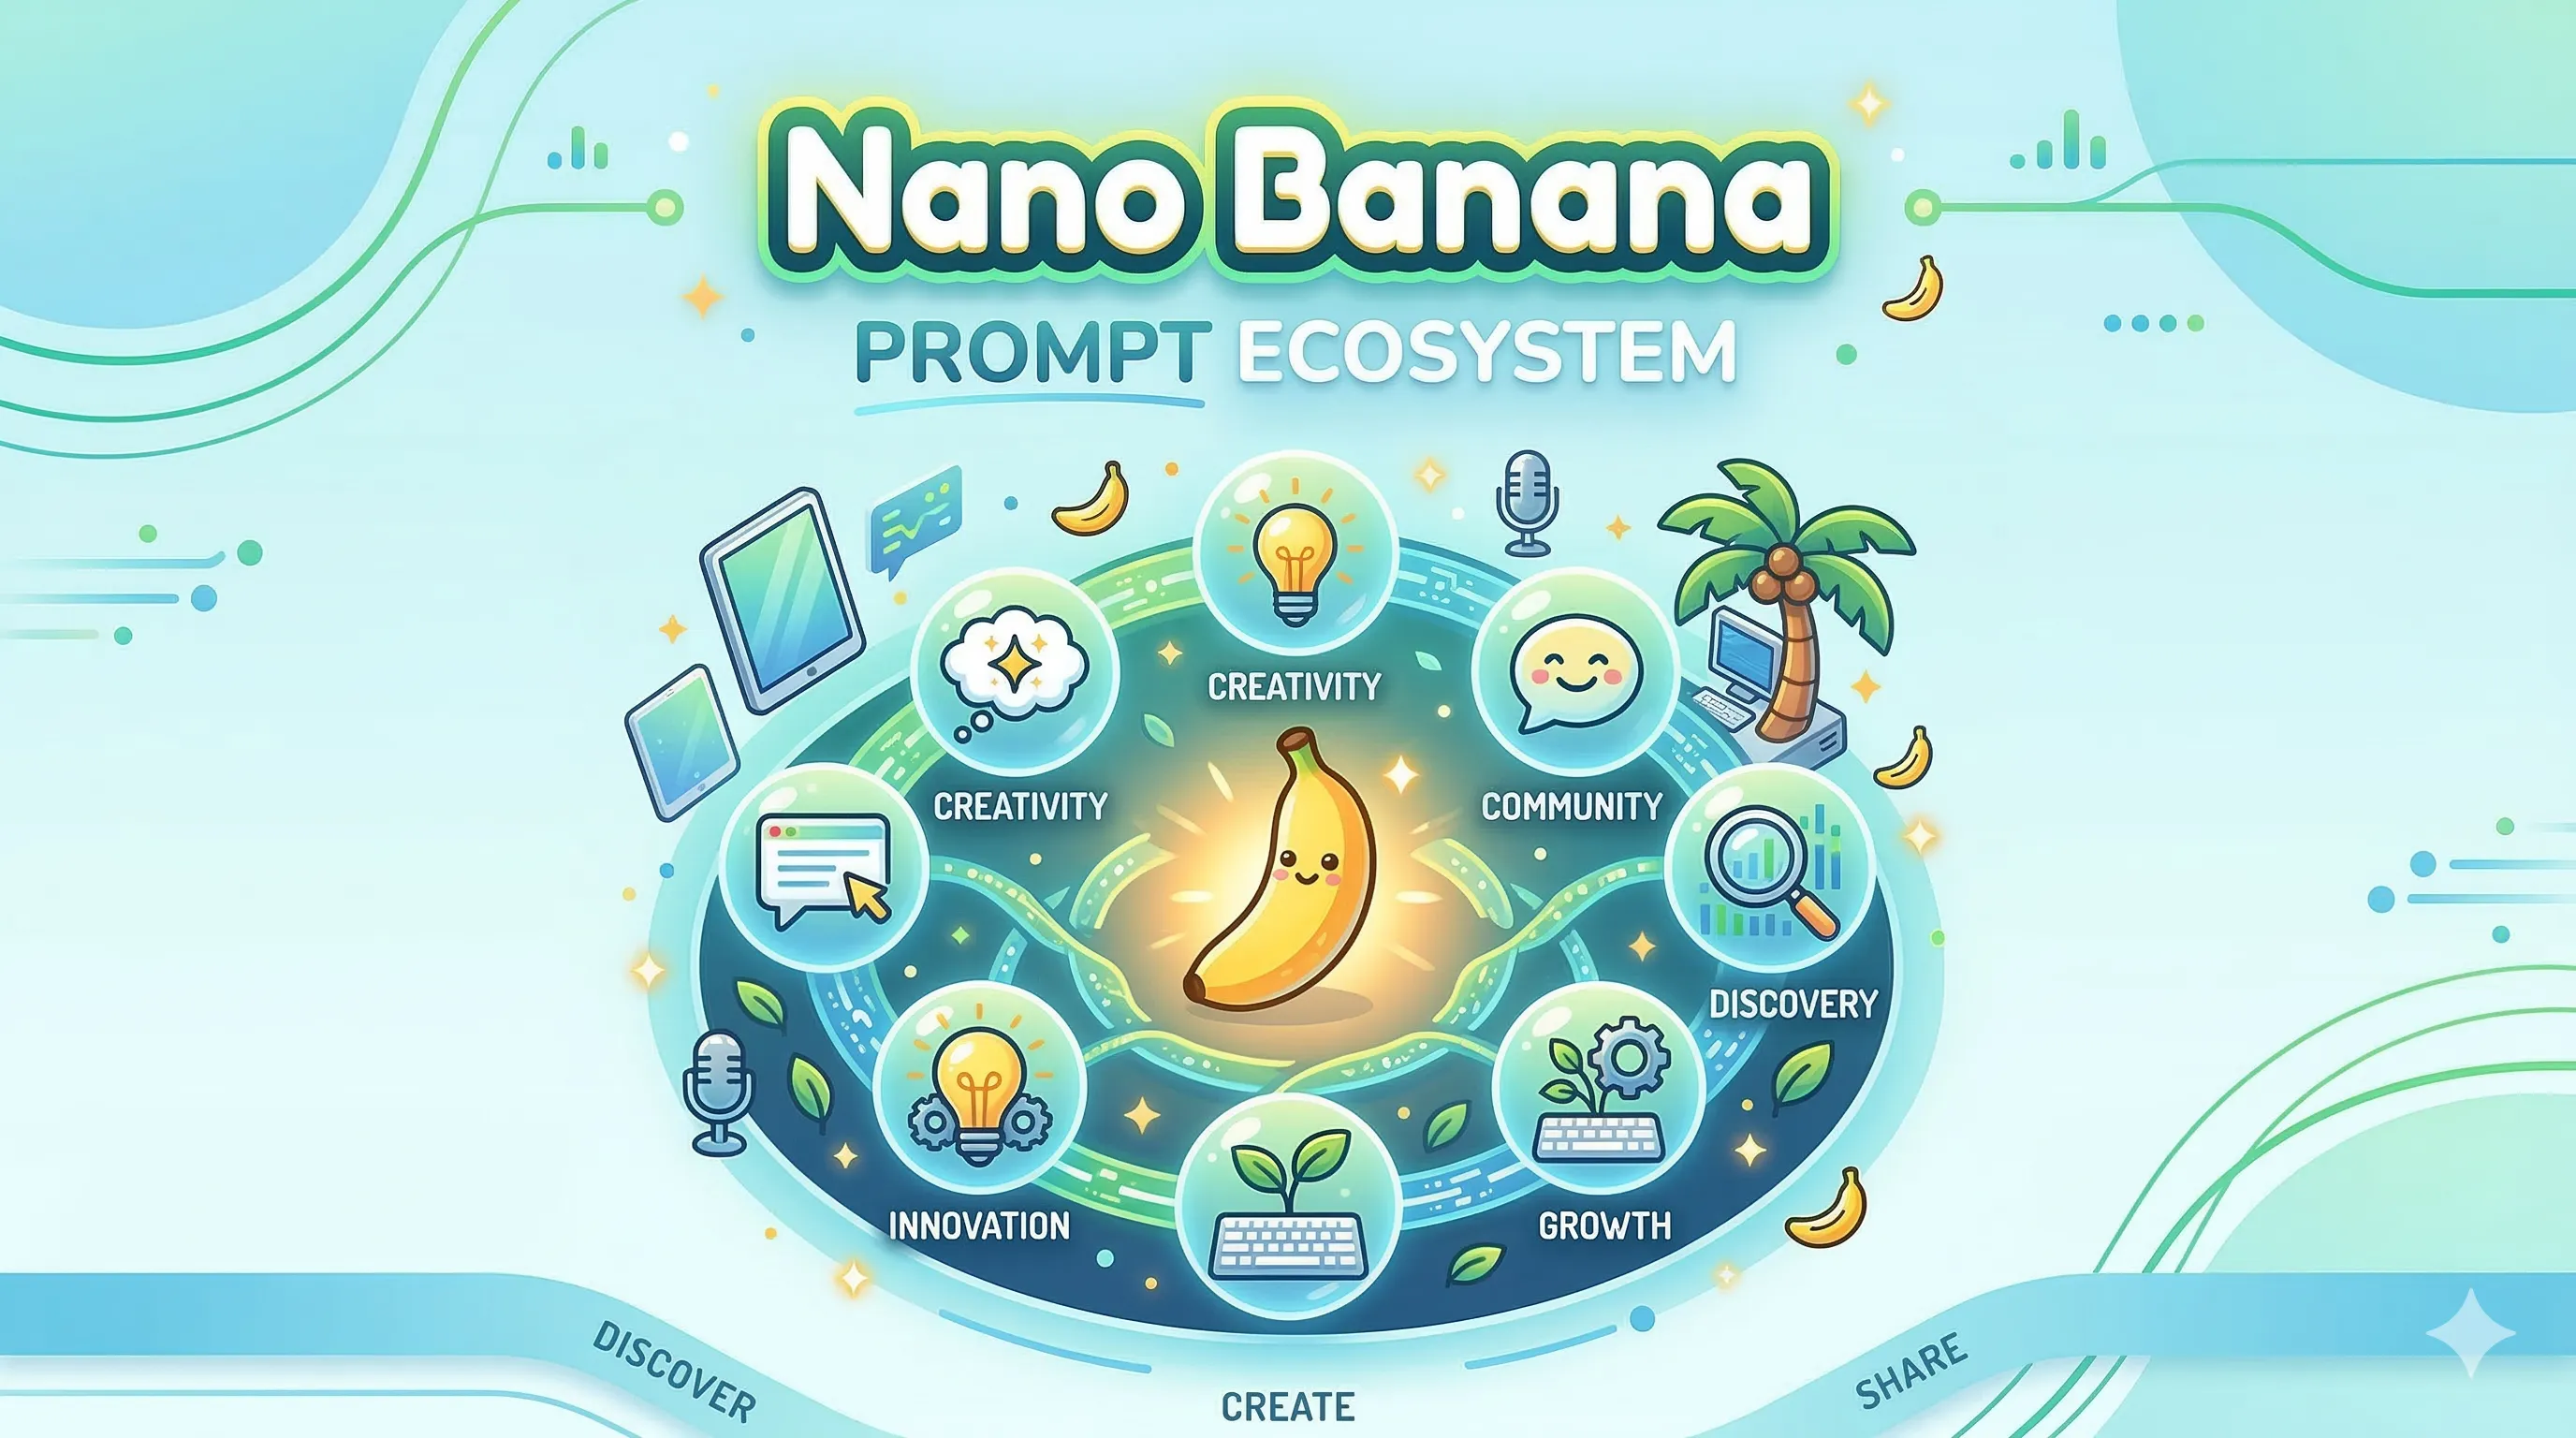
When it comes to transforming complex information into digestible formats, two powerful approaches have emerged: series infographics (powered by tools like Nano Banana) and Google NotebookLM's AI-generated audio overviews. Both serve the same fundamental purpose—making complex information accessible—but they take radically different paths. Let's explore when to use each, and how they can complement each other in your content strategy.
What Are Series Infographics?
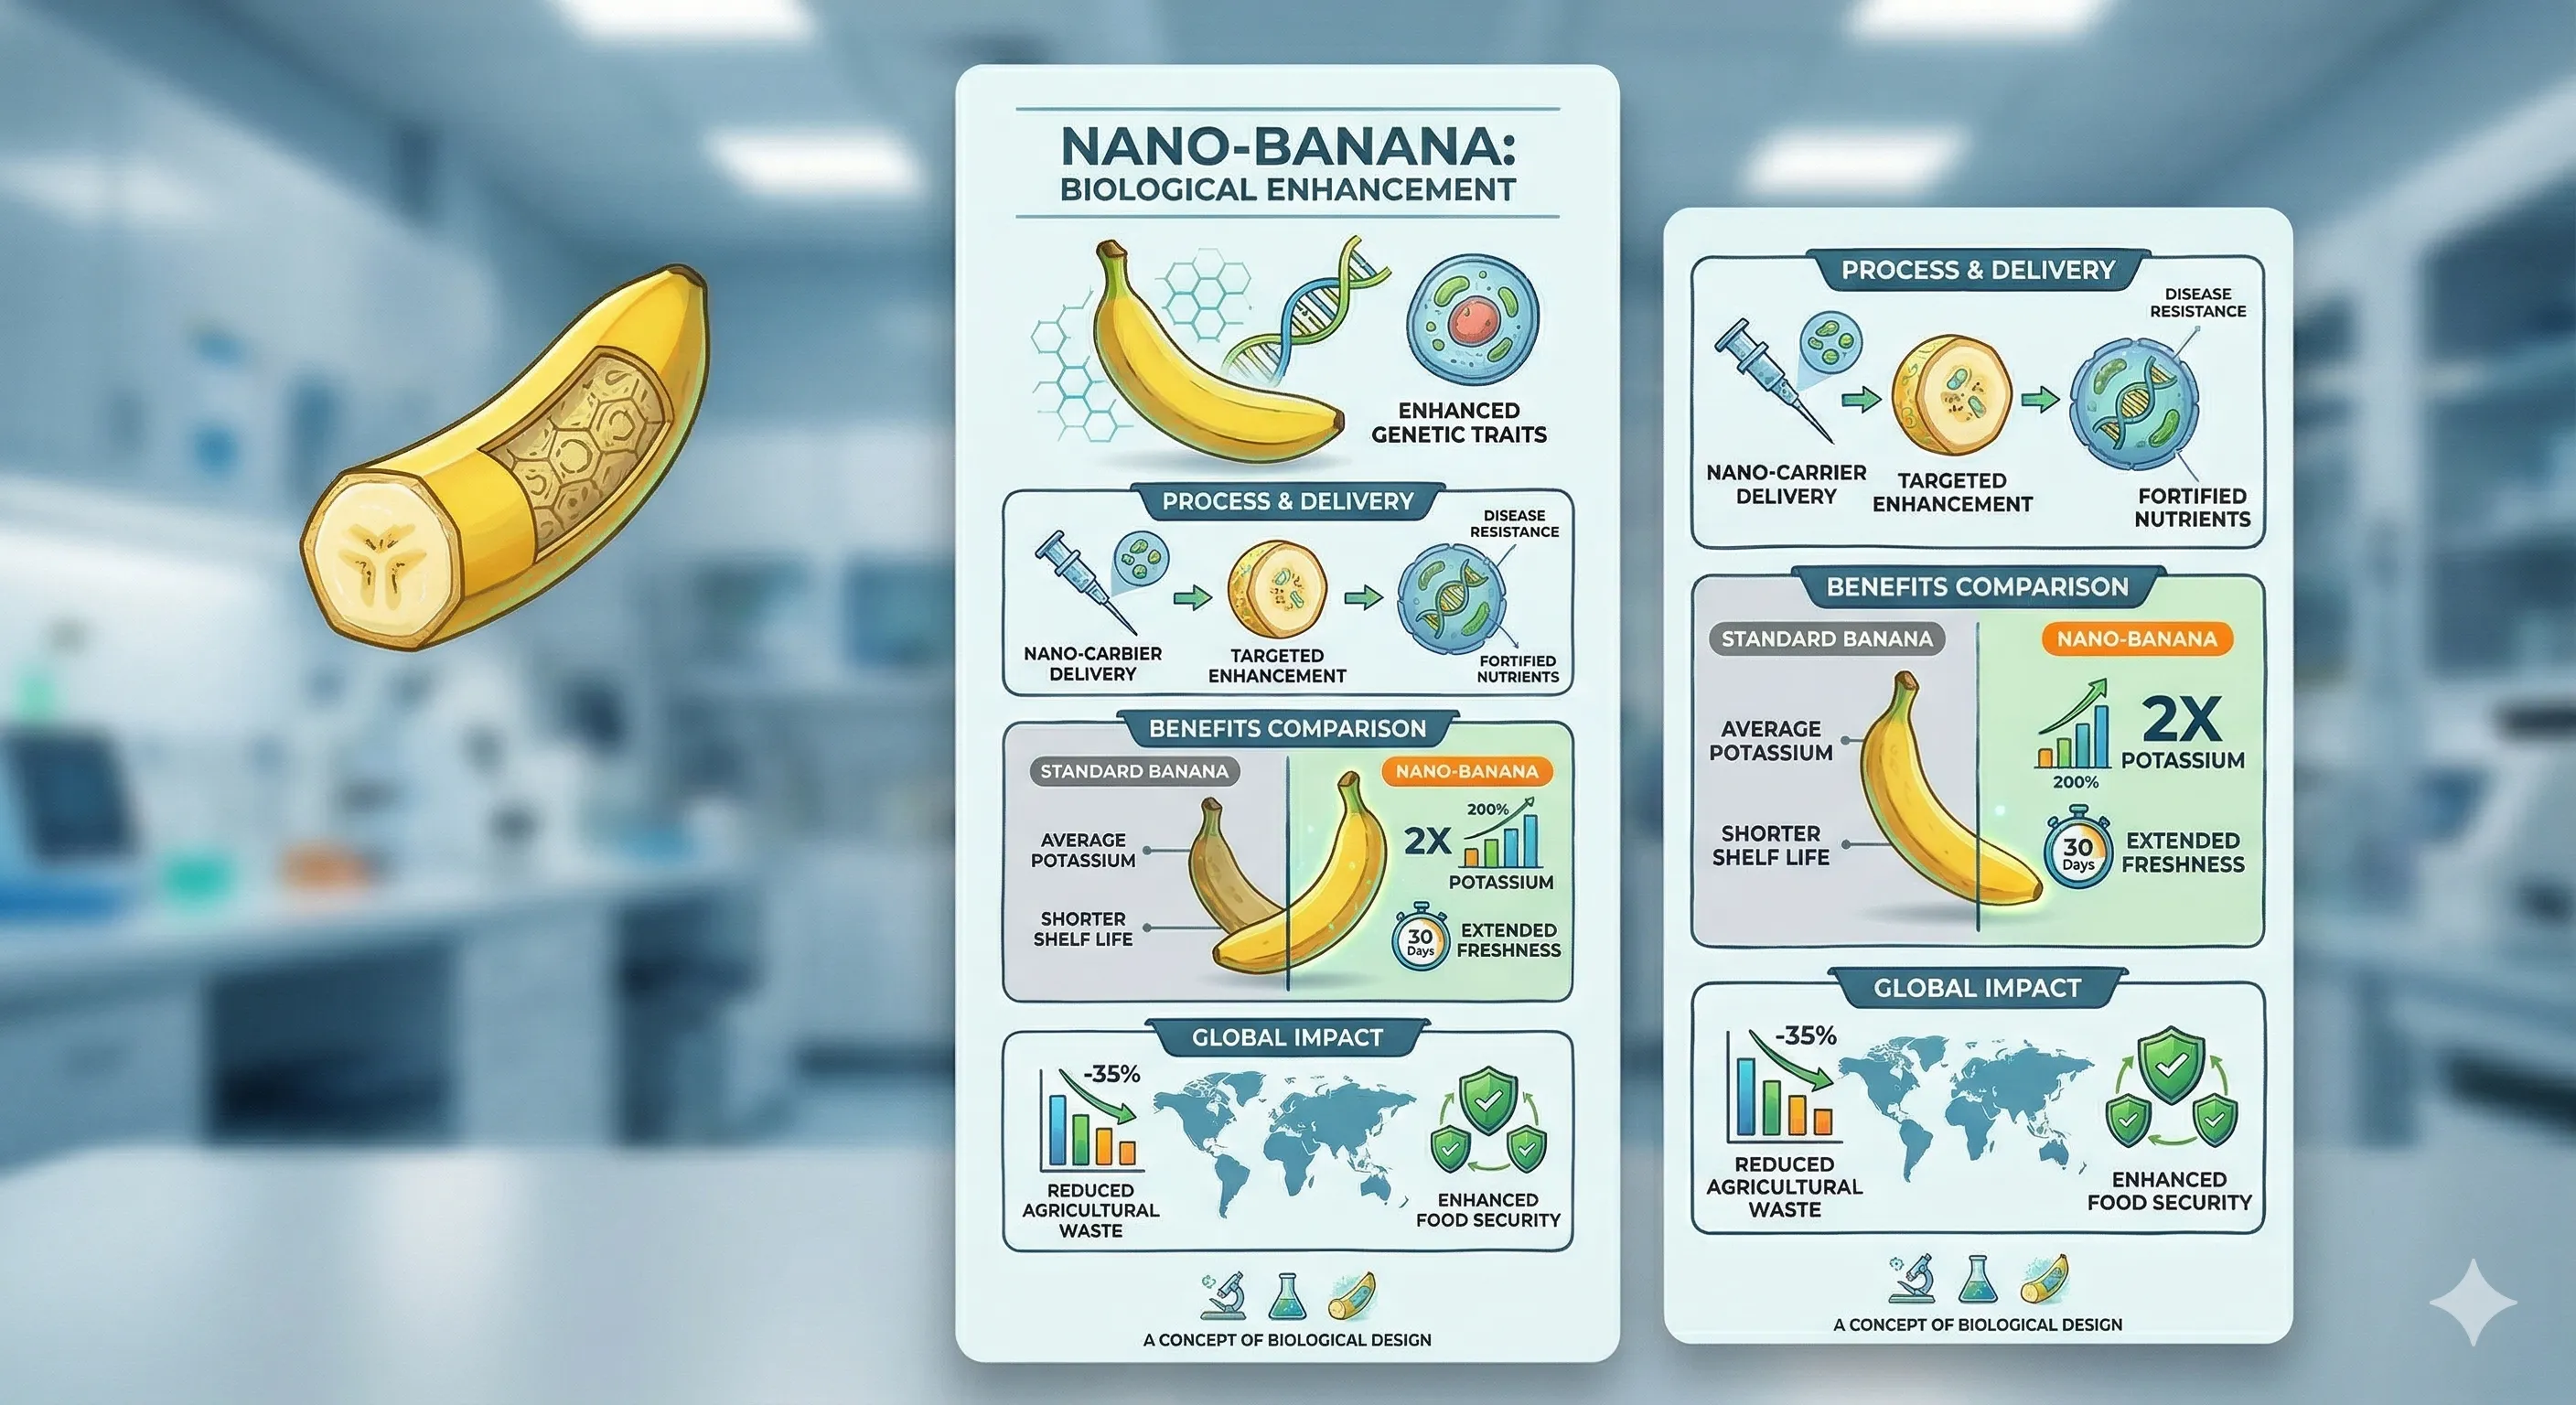
Series infographics are structured visual presentations that break down complex topics into a sequence of related visual cards. Each card focuses on a specific aspect, creating a coherent narrative through visual design. Think of them as visual storyboards or educational comic strips that can be shared digitally (social media, blogs) or printed (posters, exhibitions).
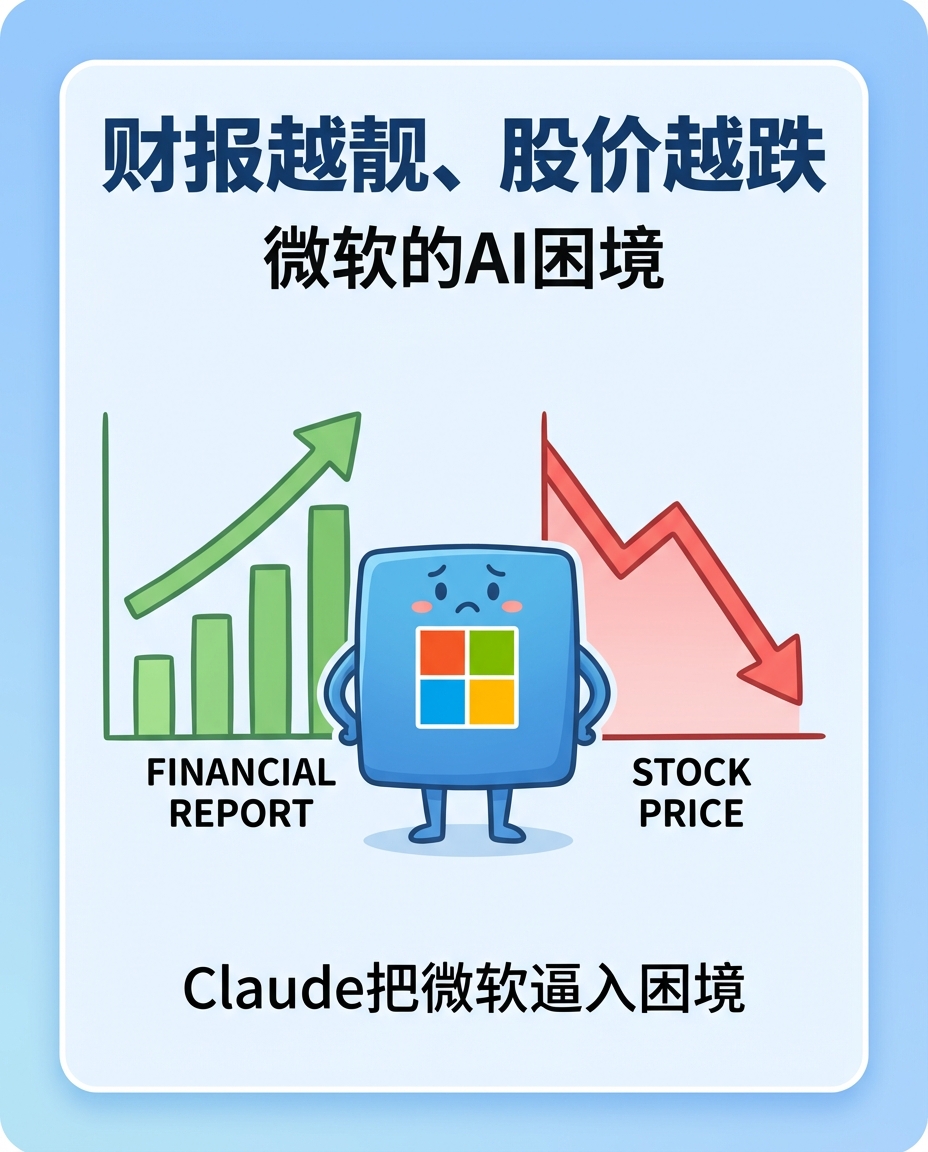
Example: Microsoft AI Dilemma Series
A series infographic exploring Microsoft's AI strategy might include: Card 1 (Cover), Card 2 (Performance vs Stock), Card 3 (Market Position), Card 4 (Future Outlook). Each card is visually consistent but tells a specific part of the story.
What is Google NotebookLM?
Google NotebookLM is an AI-powered research assistant that takes your documents, notes, and sources and generates audio overviews (podcast-style conversations) and text summaries. It uses AI to synthesize information and present it in a conversational, narrative format—like having two experts discuss your topic.
Example: AI Research Paper Overview
Upload a research paper about AI ethics, and NotebookLM generates a 10-minute audio overview where two AI hosts discuss the key findings, implications, and takeaways in natural conversation.
Head-to-Head Comparison
| Category | Series Infographics | Google NotebookLM |
|---|---|---|
| Content Format | Visual cards with structured information | Audio overviews and text summaries |
| Learning Style | Visual learners - scanable, bite-sized | Auditory/text learners - narrative format |
| Information Density | High density, visually organized | Medium density, linear narrative |
| Use Case | Quick reference, social sharing, posters | Deep research, study sessions, podcasts |
| Production Speed | Fast with AI templates (Nano Banana) | Fast for audio, slower for complex visuals |
| Customization | Highly customizable design and layout | Limited customization, AI-generated format |
Visual Comparison: Series Infographics vs NotebookLM
This flowchart shows how complex information can be transformed using either visual (Series Infographics) or narrative (NotebookLM) approaches, each with distinct strengths and ideal use cases.
When to Use Series Infographics
Social Media Content
Perfect for Instagram carousels, Twitter threads, and LinkedIn posts where visual impact and shareability matter.
Educational Materials
Ideal for classroom posters, study guides, and educational content where students need to scan and review information quickly.
Business Presentations
Great for slide decks, annual reports, and marketing materials where visual hierarchy and professional design are crucial.
Physical Artifacts
Excellent for posters, exhibition displays, and printed materials that need to work in physical spaces.
When to Use Google NotebookLM
Research Deep Dives
Perfect for academic research, literature reviews, and complex topic exploration where narrative explanation helps understanding.
Audio Learning
Ideal for podcast-style learning, commutes, and situations where listening is more convenient than reading.
Quick Summaries
Great for getting the gist of long documents, meeting notes, or reports without reading every word.
Study Sessions
Excellent for students reviewing materials through audio, reinforcing learning through different modalities.
The Power of Combining Both Approaches
The real magic happens when you use both approaches together. Here's a workflow that leverages the strengths of each:
Start with NotebookLM to generate an audio overview and understand the key points of your source material.
Extract the main themes and structure from the NotebookLM output to plan your infographic series.
Use Nano Banana prompts to create visually stunning series infographics based on that structure.
Distribute both formats: audio for podcasts and deep learners, infographics for social media and visual learners.
Nano Banana Prompt for Series Infographics
Series Infographic: Microsoft AI Dilemma
Use this prompt template to create series infographics for any complex topic, adapting the card structure to your specific needs.
Conclusion: Choose the Right Tool for the Right Audience
Series infographics and Google NotebookLM aren't competitors—they're complementary tools in your content arsenal. Infographics excel at visual communication, social sharing, and physical applications. NotebookLM shines at narrative explanation, audio learning, and deep research synthesis.
The key is understanding your audience and distribution channels. Visual learners scrolling through Instagram? Go with infographics. Commuters listening to podcasts? NotebookLM is your answer. And for maximum impact? Use both.
🔍 SEO Keywords
series infographics, Google NotebookLM, visual learning, audio learning, content creation, AI tools, educational content, infographic design, podcast generation, content strategy
Take the next step
Putting what you read into practice.
Browse related topics
More templates and prompts in these areas.
Related Articles
Learning & Education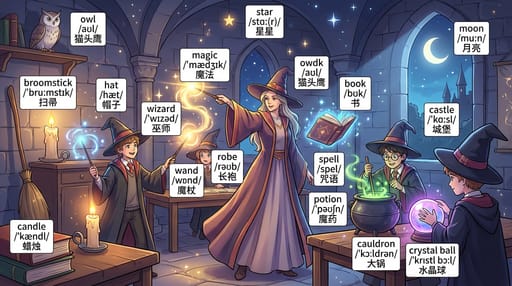
Visual Learning: AI Tools, Flashcards, and Infographics for Modern Classrooms
What is Infographics and How Can Infographic Cards Be Used?